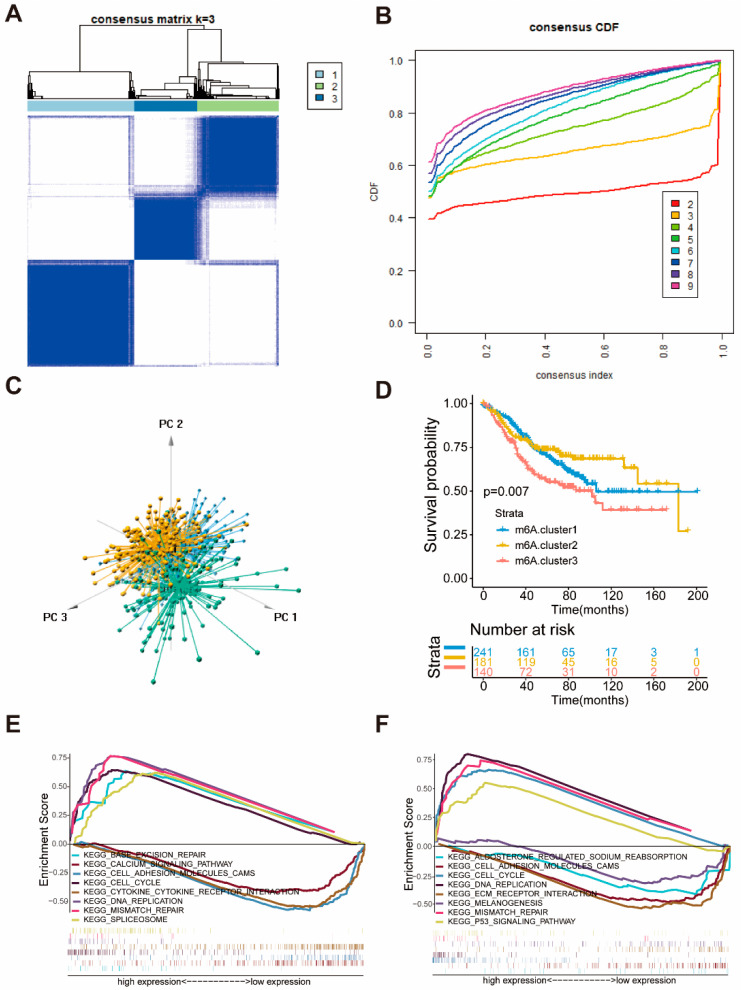
Figure 2.
Identification of three molecular subgroups of colon cancer by seven m6A regulators associated with prognosis and biological characteristic of each subgroups. (A) The consensus matrices of the GSE39582 for k = 3. (B) The cumulative function (CDF) curves in consensus cluster analysis. CDF curves of consensus score by different subtype number (k = 2–9) are represented. (C) Three-dimensional scaling plot by transcriptome profile of three subgroups. (D) Survival analyses of three subgroups based on 566 patients with colon cancer from GEO cohorts (GSE39582), including 241 cases in m6A.cluster1, 181 cases in m6A.cluster2, 140 cases in m6A.cluster3. Kaplan-Meier curves with Log-rank p-value 0.007 showed a significant survival difference among the three m6A modifications. m6A.cluster3 showed a poorer overall survival than the other two m6A.clusters. (E,F) GSEA enrichment analysis showing the activation states of biological pathways in three molecular subgroups of colon cancer. (E) m6A.cluster1 vs. m6A.cluster3. (F) m6A.cluster2 vs. m6A.cluster3.

