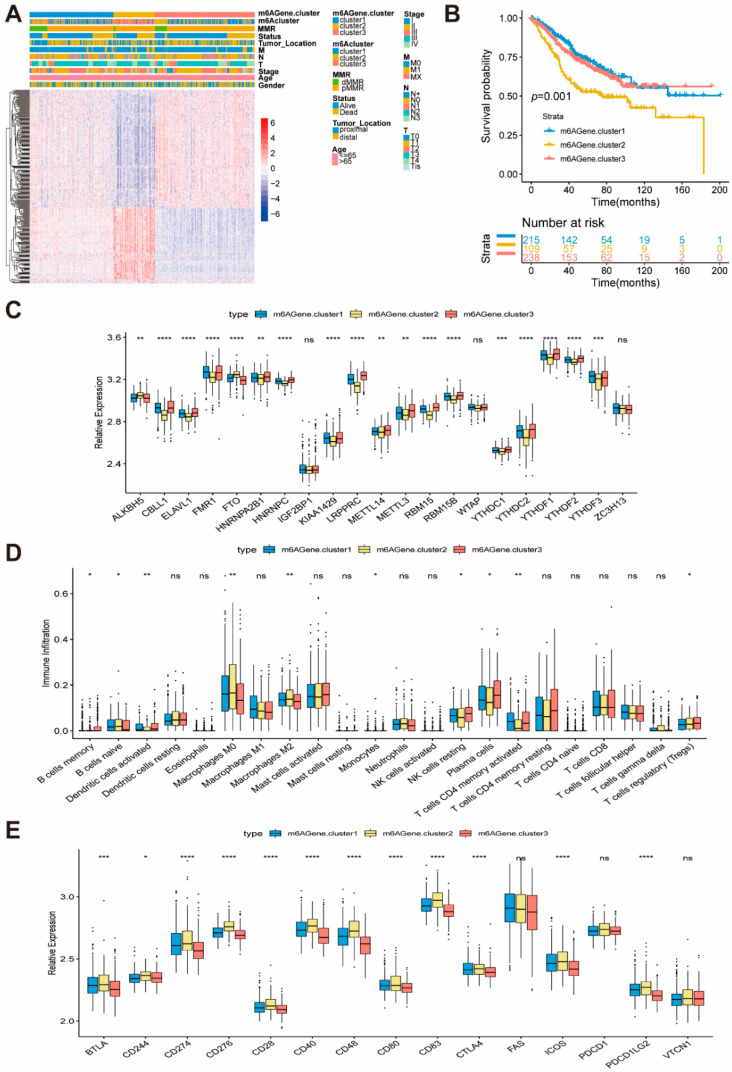
Figure 4.
Construction of m6A phenotype-related genes and function. (A) Unsupervised clustering of overlapping m6A phenotype-related genes in GSE39582 to classify patients into different genomic subtypes, termed m6AGene.cluster1/2/3, respectively. The m6AGene.cluster, m6Acluster, MMR, status, tumor_location, M, N, T, stage, age and gender were used as patient annotations. (B) Kaplan-Meier curves indicated m6A modification genomic phenotype were markedly related to overall of 562 patients in GSE39582, of which 215 cases were in m6Agene.cluster1, 109 cases were in m6Agene.cluster2, 238 cases were in m6Agene.cluster3. (p = 0.001). (C) The expression of 21 m6A regulators in the three gene clusters. The upper and lower ends of the boxes represent the interquartile range of values. The lines in the boxes represent the median value, and the black dots show the outliers. The asterisks represent the statistical p-value (* p < 0.05, ** p < 0.01, *** p < 0.001, **** p < 0.0001). (D) The abundance of each immune cells in the three gene clusters. The upper and lower ends of the boxes represent the interquartile range of values. The lines in the boxes represent the median value, and the black dots show the outliers. The asterisks represent the statistical p-value (* p < 0.05, ** p < 0.01, *** p < 0.001, **** p < 0.0001). (E) The expression of checkpoint genes in the three gene clusters. The upper and lower ends of the boxes represent the interquartile range of values. The lines in the boxes represent the median value, and the black dots show the outliers. The asterisks represent the statistical p-value (* p < 0.05, ** p < 0.01, *** p < 0.001, **** p < 0.0001).

