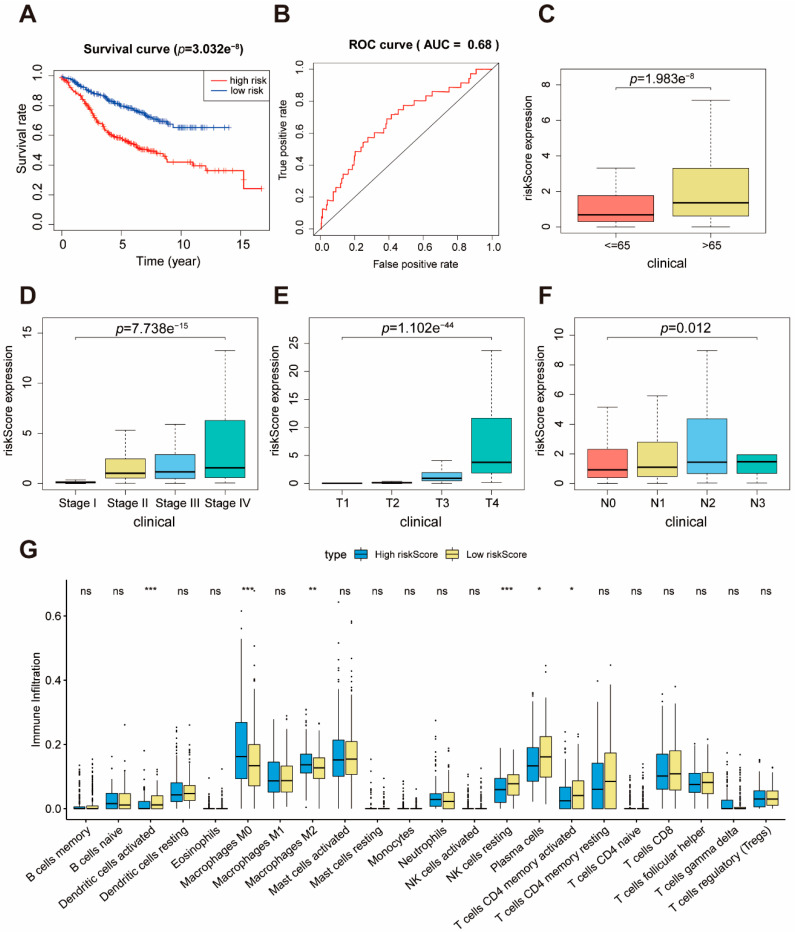
Figure 6.
Validation of the prognostic performance of m6A risk score in GSE39582. (A) The survival curves of the m6A risk score in GSE39582. Grouping was based on the median m6A risk score in the training set. Red is the high-level group, and blue is the low-level group. (B) ROC curve of the m6A risk score forecast result after 1 year. (C–F) The relationship between m6A risk score and clinical features of patients. (G) Estimated immune cell expression in high and low m6A risk score groups.

