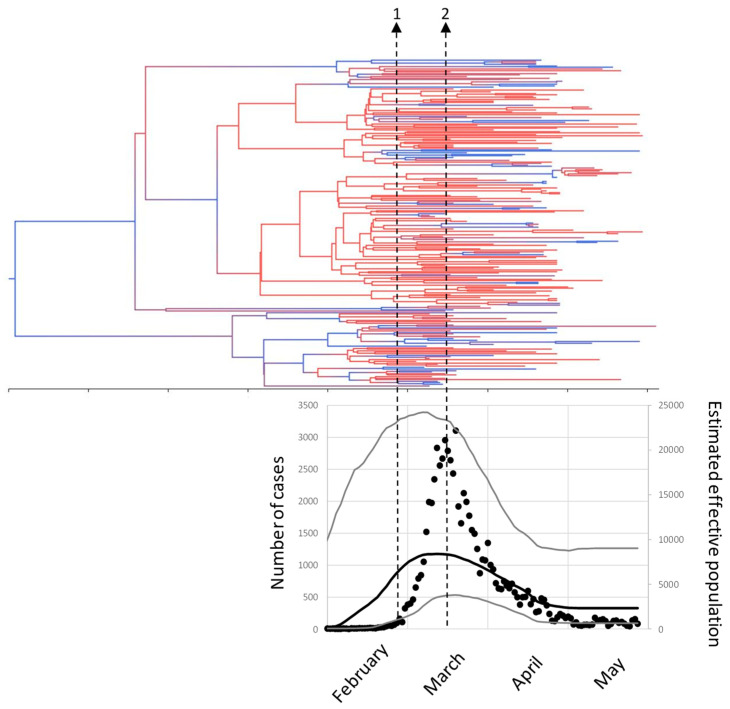
Figure 3.
Phylodynamics of SARS-CoV-2 from Madrid. The tree shows the dated phylogeny. The tree is colored with a gradient from red (HPD = 0) to blue (HPD = 1). The plot below the tree is in the same time scale and shows the number of RT-PCR-confirmed cases in Madrid (black circles, left vertical axis) and the Bayesian skyline plot estimate of the effective population size (right vertical axis), the black line is the median estimate, and the grey lines indicate the 95% HPD interval. The arrows are (1) first case reported 25 February, (2) national lockdown, March 14th.

