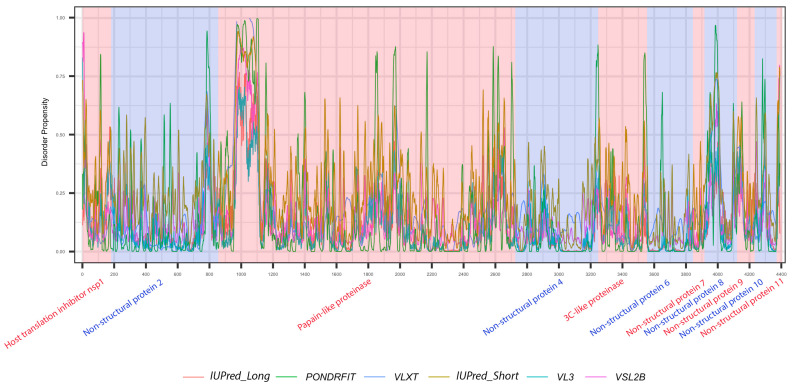
Figure 6.
Positional distribution of predicted intrinsic disorder of individual proteins generated by the cleavage of ORF1a polyproteins in MERS-CoV genome. Each color represents a per-residue disorder profile generated by IUPred_Long, PONDRFIT, VLXT, IUPred_Short, VL3, or VSL2B. Residues with scores above 0.5 are considered disordered.

