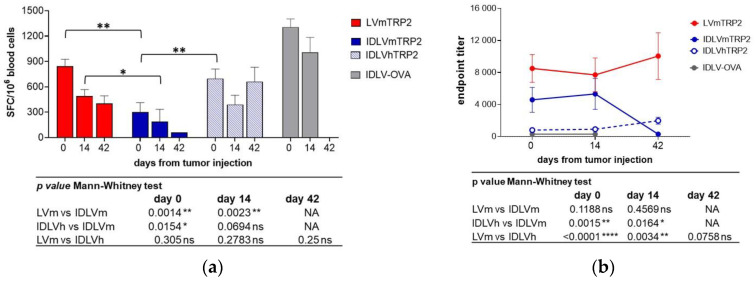
Figure 8.
Kinetics of TRP2-specific immune responses in mice immunized with IDLV delivering either murine or human TRP2 and challenged with B16F10 tumor. C57BL/6 mice (n = 9–11) immunized with vectors expressing TRP2, OVA, or left untreated were s.c. injected with 5 × 10⁴ B16F10 cells/mouse after 30 days from immunization, as depicted in Figure 7a. (a) TRP2-specific T cell response was evaluated by IFNγ ELISPOT, measured at different time points in blood. Cells were collected and stimulated with H-2Kb restricted TRP2 9mer peptide (SVYDFFVWL). Data are expressed as mean spot forming cells (SFC) per 106 cells, bars represent standard error among animals from the same group. (b) Anti-mTRP2 IgG antibodies were analyzed in plasma of immunized animals by ELISA. Data are expressed as mean of endpoint titers and bars represent standard error among animals from the same group. Comparison among groups was evaluated using the Mann–Whitney test, as indicated by p values shown in the tables under the graphs. * p < 0.05; ** p < 0.01; **** p < 0.0001. NA: The comparison was not performed since only one animal from IDLVmTRP2 group was alive at day 42.

