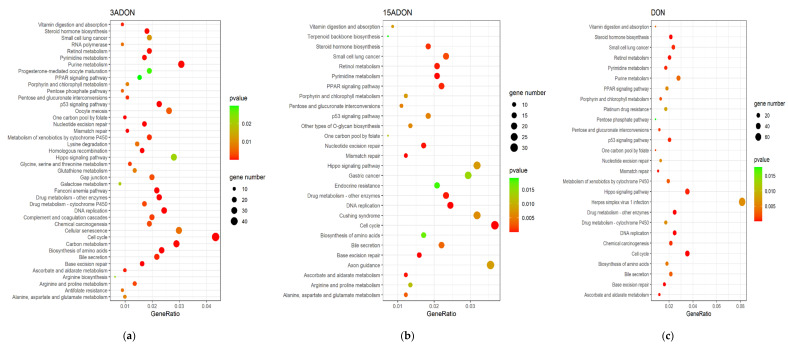
Figure 4.
Bubbles of Kyoto Encyclopedia of Gene and Genome (KEGG) pathways of the DEGs. The size of bubbles represents the number of DEGs enriched in the pathway, the colors of bubbles indicate higher enrichment (lower p-value) in red. (a) 3-ADON treated group. Among the 42 pathways, cell cycle pathway was significantly influenced. (b) 15-ADON treated group. Among 28 pathways, cell cycle and DNA replication pathways were significantly affected. (c) DON treated group. Among 27 pathways, cell cycle and hippo signaling pathways were significantly affected.

