Figure 3.
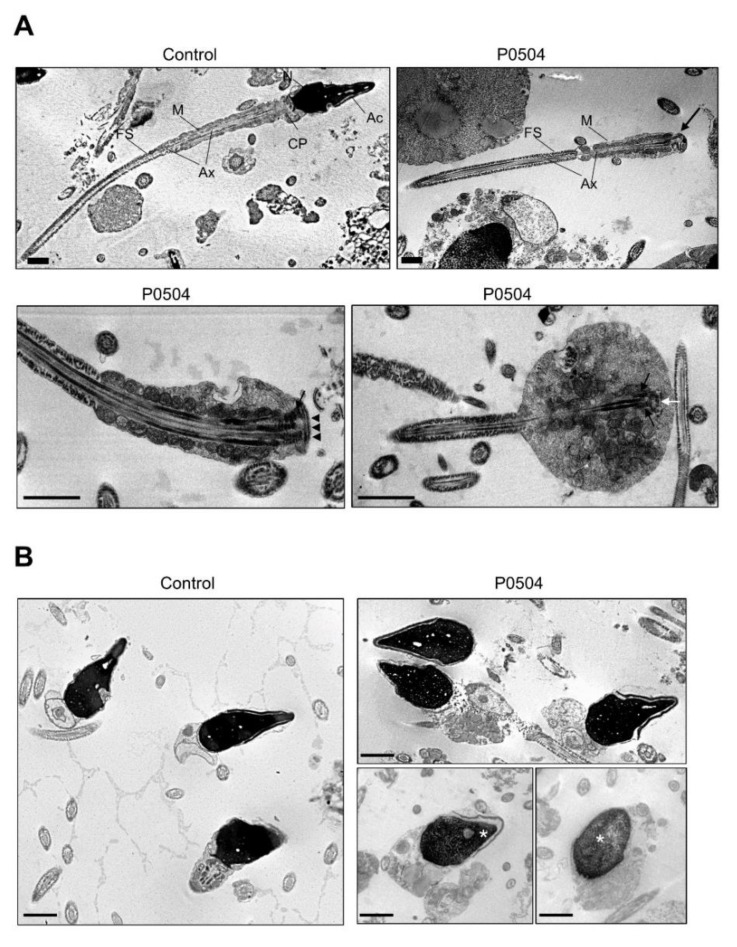
Sperm ultrastructure analysis by transmission electron microscopy (TEM). TEM analysis of semen samples from a control individual and from individual P0504. (A) Longitudinal sections of sperm flagella showing an overall regular organization of the midpiece and principal piece in the sample from individual P0504, although some flagella were identified with cytoplasmic remnants and an irregular mitochondrial sheath. The head–tail junction was also clearly distinguishable, as were the centriole (white arrow) and the striated columns (black arrow); the basal plate was also visible (black arrowheads). Ac: acrosome; N: nucleus; MS: mitochondrial sheath; Ax: axoneme; FS: fibrous sheath. Scale bars represent 1 µm. (B) Analysis of isolated heads in the semen sample from individual P0504 showing normal acrosomal structure but altered chromatin condensation (white asterisk). Scale bars represent 1 μm.

