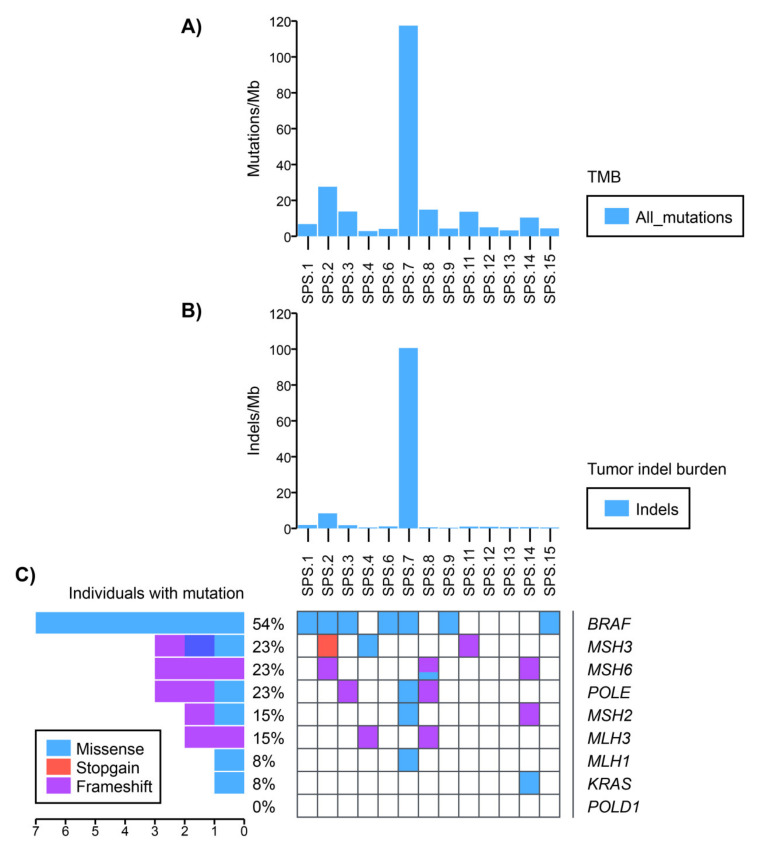
Figure 3.
Somatic mutational profile of the SPS cohort. (A) Tumor mutational burden (TMB) per sample. (B) Tumor indel burden per sample. (C) Most frequent mutated cancer driver genes in each sample. Identified mutations in the most relevant cancer driver genes such as POLE/POLD1, MMR genes (MLH1, MLH3, MSH2, MSH3, MSH6, PMS2), BRAF and KRAS were analyzed in the individuals with somatic WES without using the AAF threshold of 20%.

