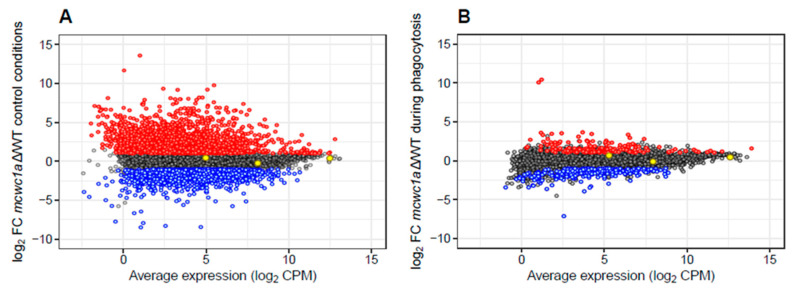
Figure 2.
Scatter plots of gene expression values in the mcwc-1aΔ mutant at 5 h during regular growth (A) and macrophage phagocytosis (B) compared to gene expression in the wild-type strain. Each dot represents the expression value of any given gene as CPM (in log2 units, x-axis) and the fold change (FC) compared to the wild-type expression value (in log2 units, y-axis). Genes color-coded as red or blue indicate upregulated or downregulated significant genes (FDR ≤ 0.05, average log2 CPM > 0, log2 FC ≥ |1|), respectively. Three housekeeping genes—encoding EF-1, TFIIIC, and V-ATPase—are shown colored as yellow to assure proper normalization among samples.

