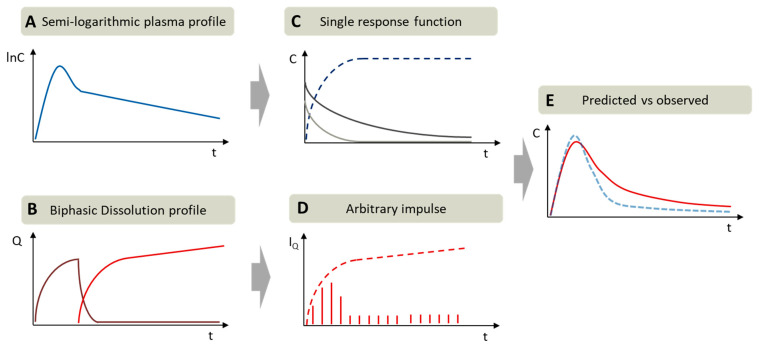
Figure 3.
Exemplary procedure of pharmacokinetic parametrization by residual method (curve stripping) and in vivo prediction assessment: (A) Semi-logarithmic plasma concentration time profile; (B) biphasic dissolution profile: aqueous phase (purple) and organic phase (red); (C) first order absorption (dark blue) and the determined single impulse functions: distribution (light grey), elimination (dark grey) received by residual method; (D) Arbitrary impulses (IQ) calculated by in vitro partitioning rate on each time point (red stripes), (E) comparison of predicted plasma profile (red) vs. observed plasma profile (blue).

