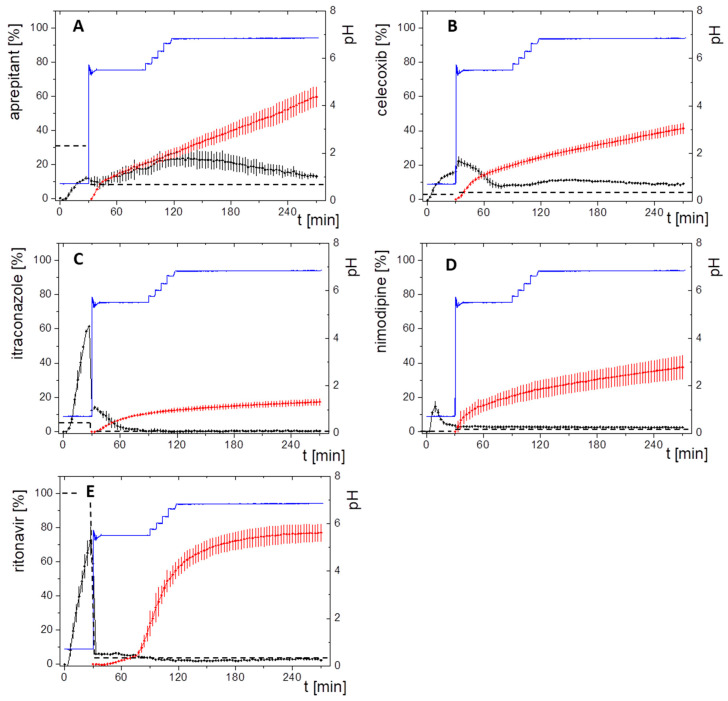
Figure 5.
Biphasic dissolution profiles at 10 mg in vitro dose strength for (A) aprepitant; (B) celecoxib, (C) itraconazole; (D) nimodipine; (E) ritonavir. Drug concentration in the aqueous layer (black line), and in the organic layer (red line); pH in the aqueous layer during dissolution test (blue line); crystalline drug solubility in the aqueous layer (black dotted line).

