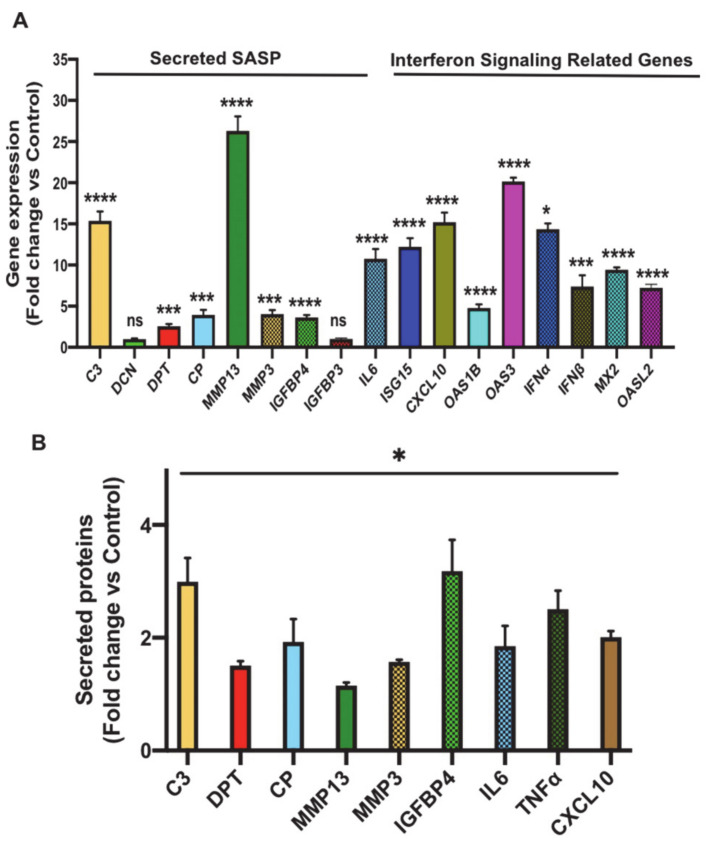
Figure 4.
Validation of expression and/or secretion of the most differentially upregulated SASP and interferon/STAT signaling related genes that were identified in the transcriptomics analysis of senescent preadipocytes. (A) Gene expression analysis of the most significantly upregulated putative SASP molecules in senescent 3T3-L1 preadipocytes (Day 7) compared to untreated control by real-time quantitative polymerase chain reaction (qPCR). Results (fold change vs. control) are presented as means ± SEM from three independent experiments. * p ≤ 0.05, *** p ≤ 0.001, **** p ≤ 0.0001 (Student’s t-test). (B) Graph represents data for ImageJ quantification of the intensity of the signal of the indicated secreted molecule in conditioned media of senescent preadipocytes compared to untreated cells. Data are means ± SEM from 3 independent experiments. * p ≤ 0.05 (Student’s t-test).

