Figure 7.
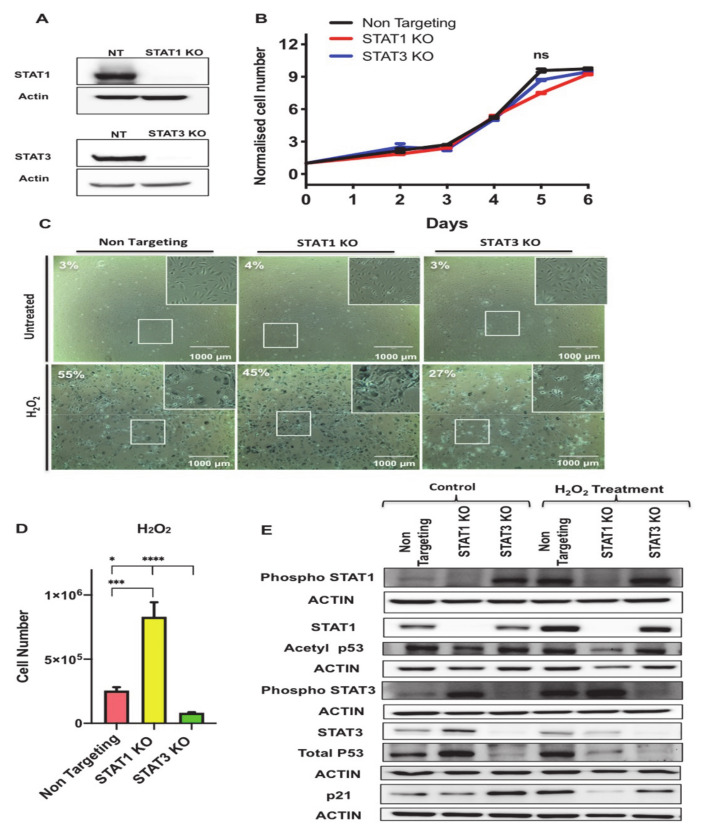
Antagonistic functions of STAT1 and STAT3 in regulating growth arrest and cell survival phenotypes in senescent preadipocytes. (A) Western blot assessing the protein levels of STAT1 and STAT3 in control NT, STAT1 KO, STAT3 KO cells. Actin was used as loading control. (B) Growth curve analysis of untreated non-targeting (NT), STAT1 KO, and STAT3 KO preadipocytes. The number of live preadipocytes in each condition was counted on different days and represented as a fold-increase over the number of seeded preadipocytes on Day-1. Results are presented as means ± SEM of three independent experiments. (C) Senescence-associated β-galactosidase (SA-β-gal) staining of proliferating (untreated) or H2O2 treated non-targeting (NT), STAT1 KO, and STAT3 KO preadipocytes. SA-β-gal positive preadipocytes were quantified from four different fields and represented as a percentage as indicated within the images. Scale bar: 1000 μm. (D) Graph represents the count of cell number of NT, STAT1 KO, and STAT3 KO following H2O2 treatment protocol. Results are presented as means ±SEM of three independent experiments. * p ≤ 0.05, *** p ≤ 0.001, **** p ≤ 0.0001 (ANOVA with post-hoc Tukey test). (E) Western blot of phospho-STAT1 (Y701), STAT1, phospho-STAT3 (Y705), STAT3, acetylated p53 (Lys375), total p53, p21 in untreated NT, STAT1 KO, and STAT3 KO preadipocytes vs. H2O2 treated counterparts as indicated. Actin was used as loading control. Results are represented as means ± SEM from three independent experiments.

