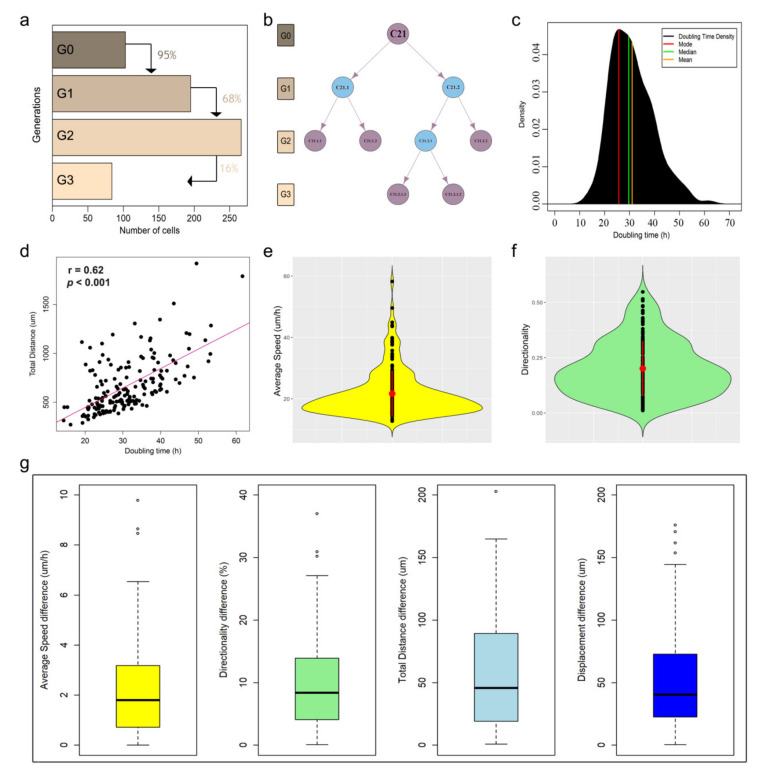
Figure 3.
Characterizing the trajectory movement of BT549 cells. (a) Bar plot showing number of tracked cells per generation. (b) Lineage tree of cell #21 and its descendants; blue vertices refer to dividing daughter cells. (c) Density plot of the doubling time of BT549 cells (n = 175). (d) Correlation between BT549 doubling time and total migration distance (Spearman’s rank correlation coefficient = 0.6). (e,f) Violin plots showing the median and the interquartile range of the average speed and directionality of BT549 cells. (g) Boxplots showing the heterogeneity among BT549 daughter cells (n = 121 pairs) as a function of four migration parameters: total distance, displacement, directionality, and average speed.

