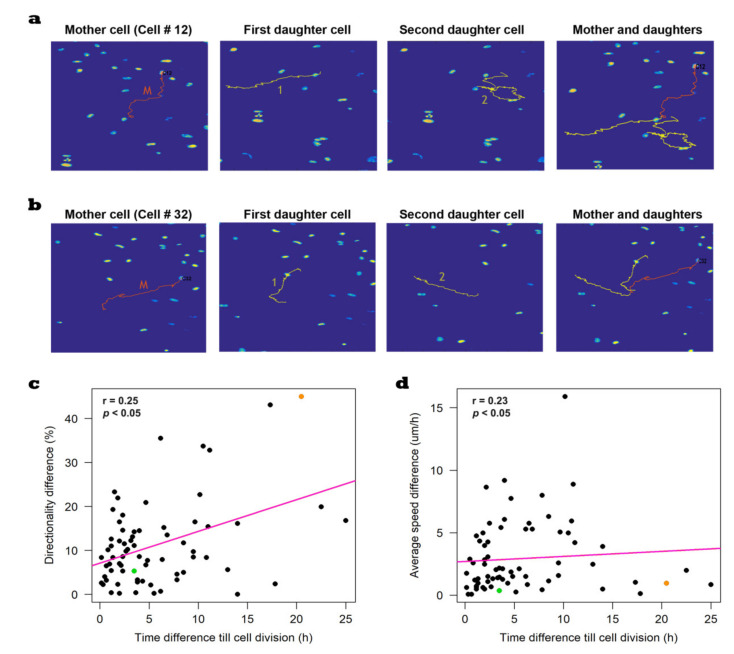
Figure 4.
Representative examples of the heterogeneity between BT549 daughter cells. (a) An example of a cell (cell number 12 in red) with heterogeneous daughter cells (yellow). (b) An example of a cell (cell number 32 in red) with relatively homogeneous daughter cells (yellow). (c,d) Weak correlation between the time difference till cell division with both the directionality difference between daughter cells (Spearman’s rank correlation coefficient = 0.25) and the average speed difference (Spearman’s rank correlation coefficient = 0.23) between daughter cells. In the scatter plots, the orange dot represents the difference between daughter cells of cell number 12, whereas the green dot represents the difference between daughter cells of cell number 32.

