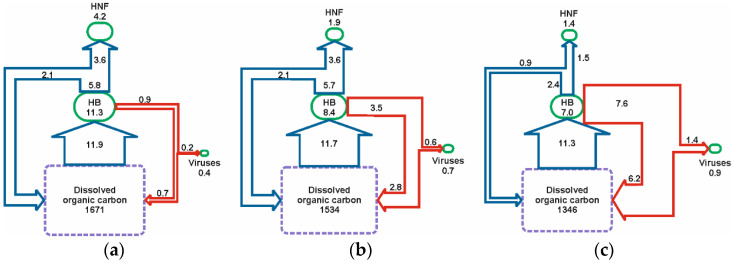
Figure 4.
Diagrammatic representation of shifting carbon flow through the microbial loop (blue lines) and viral shunt (red lines) from: (a) December 2010, (b) to January 2011, and (c) to February 2011. Green boxes represent the carbon contained within the biogenic pools of heterotrophic bacterioplankton (HB), virioplankton, and heterotrophic nanoflagellates (HNFs) and values given have the units µg C L−1. Arrows represent the flux of carbon from one pool to another and values given have the units µg C L−1 day−1. Size of the boxes and thickness of the arrows is indicative of the magnitude of the carbon they represent with the exception of dissolved organic carbon (purple box), which, given its much greater magnitude, is not drawn to scale with the other budget components.

