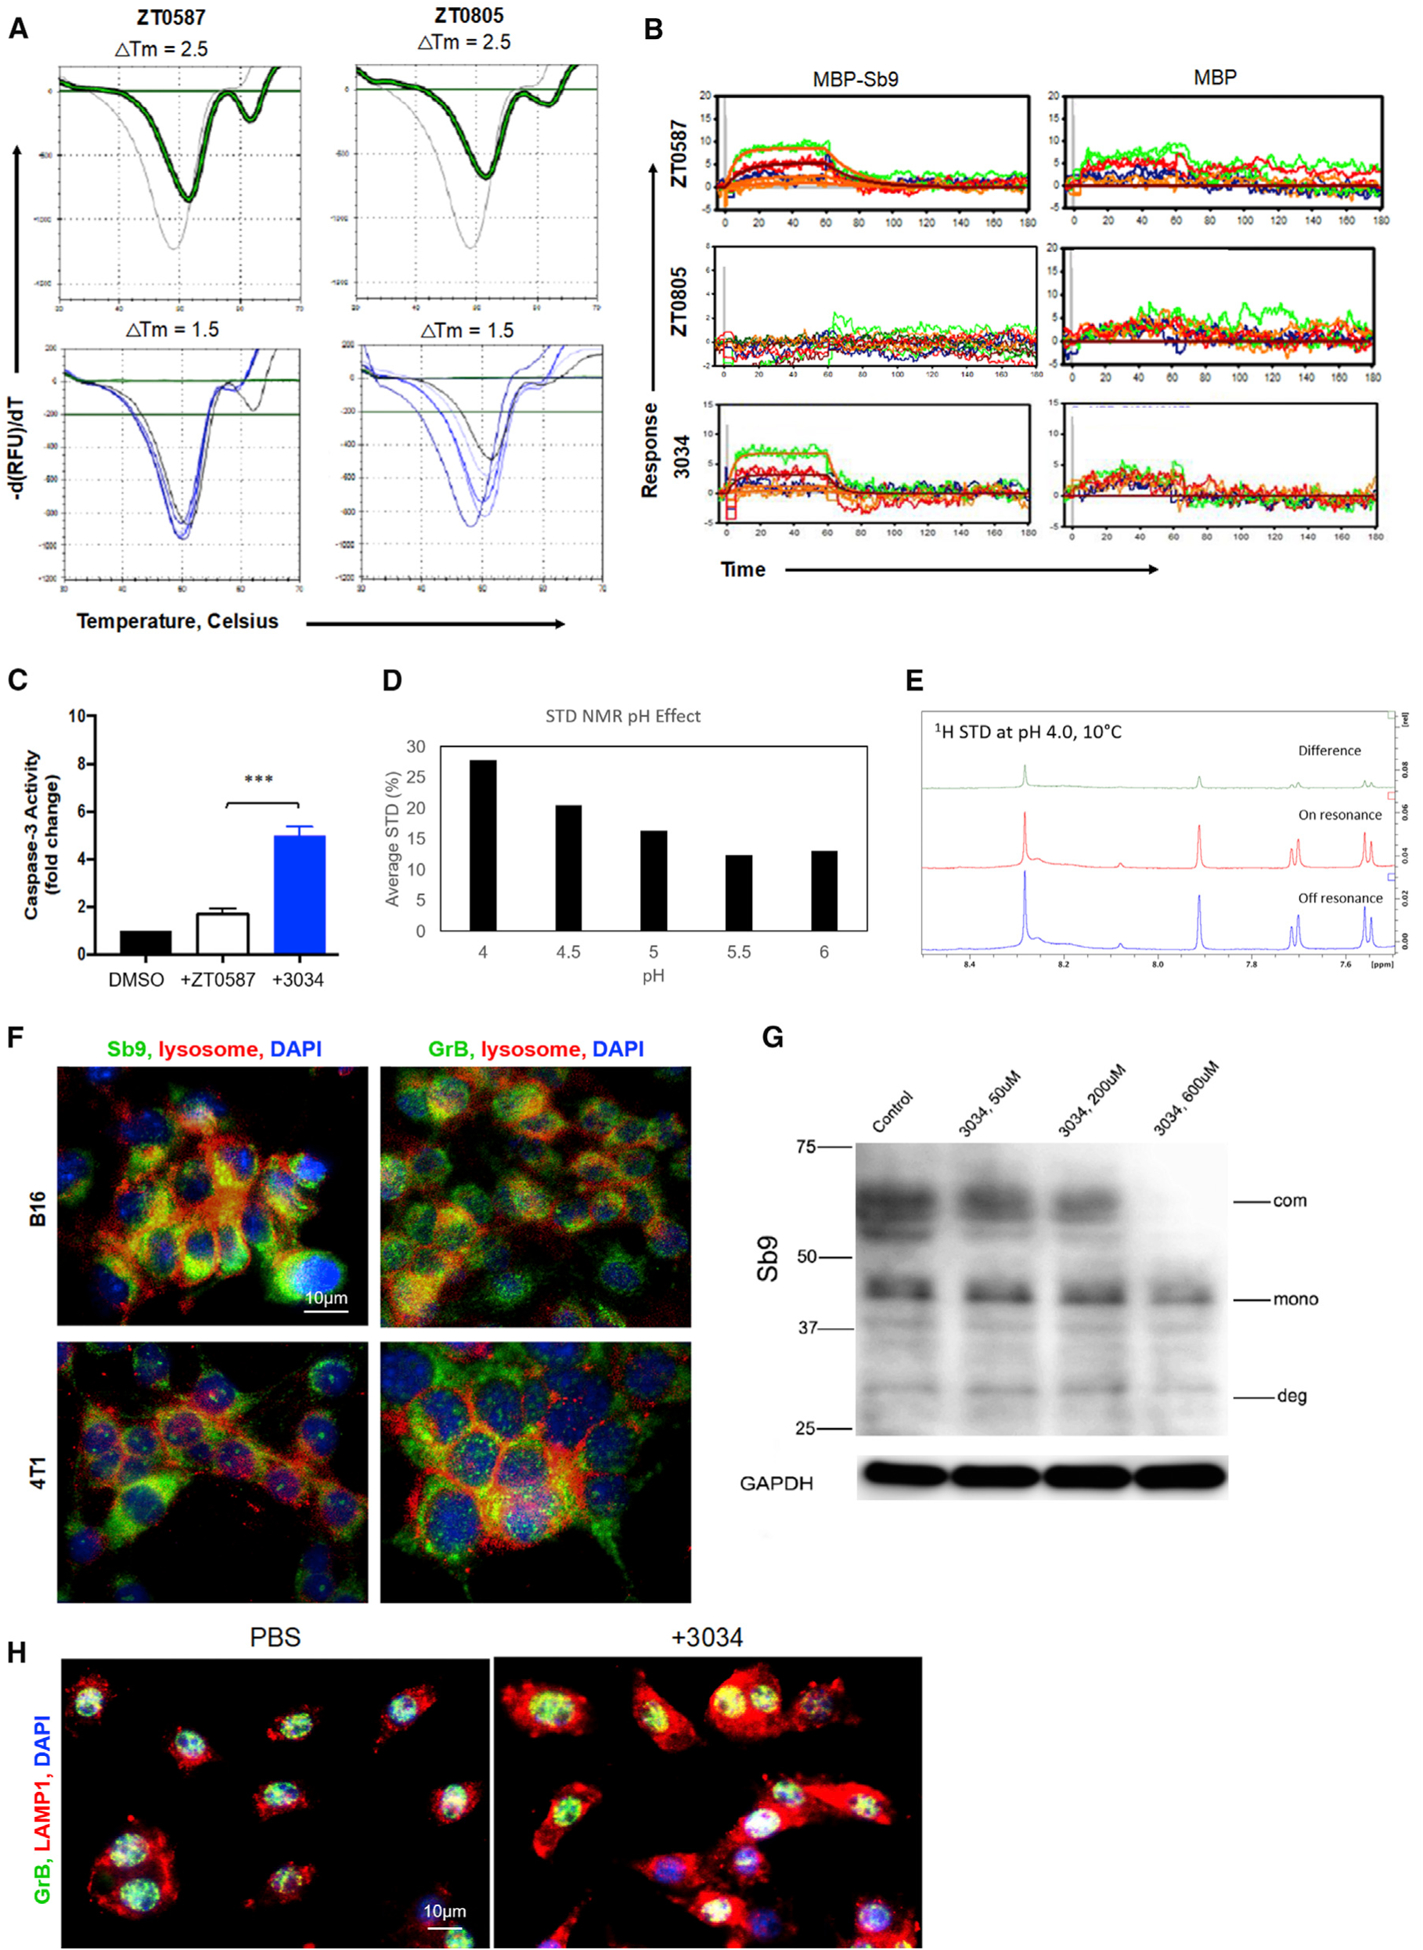
Figure 4. Small Molecule Inhibitors of Sb9 Evoke Protective Immunity to Tumors.

(A) The upper panels show the TSA results of the MBP-Sb9 protein incubated with 5 mM ZT0587 and ZT0805, or with 2.5% DMSO. The thermal shifts of the compounds ZT0587 and ZT0805 are shown in green against a baseline control shown in gray. The bottom panels showed the TSA results of the MBP-Sb9 incubated with ZT0587 or ZT0805 at different concentrations, including 5000, 1667, 556, 185, 62, and 21 μM. The concentration-response curves are plotted in a blue color scale (higher intensity is higher concentration) and the green plots represent the compound background signal.
(B) Sensorgrams of compounds ZT0587, ZT0805, and 3034 show the binding of compounds ZT0587 and 3034 to Sb9 (left), but not to MBP (right) by surface plasmon resonance (SPR).
(C) Comparison of caspase-3 activity among B16 melanoma cells treated with compounds ZT0587 and 3034 (200 μM) for 24 h demonstrated that compound 3034 induced highest activity, as determined by the EnzChek Caspase-3 Assay Kit. ***p < 0.001.
(D and E) Saturation-transfer difference (STD) NMR assays of compound 3034 (450 μM) and Sb9 protein (45 μM) at various pH values are provided. (D) Aromatic region of STD NMR spectrum showing compound 3034 in the presence of Sb9 protein at pH 4.0 and 10°C, exhibiting large saturation difference (green trace) comparing on-resonance (red) and off-resonance (blue) 1d 1H spectra. (E) Plots of averaged STD scores (%) of aromatic peaks showing binding of compound 3034 to MBP-Sb9 protein is enhanced significantly at lower pH in a pH-dependent manner.
(F) Fluorescence micrographs demonstrate the presence of Sb9 (green, left) and GrB (green, right) in the lysosomes (red) of B16 and 4T1 cells. DAPI (blue) was the nuclei. Scale bar, 10 μm.
(G) Western blot shows that compound 3034 reduces Sb9-GrB complex in a concentration-dependent manner in B16 cells. Sb9-GrB complex (com), unbound Sb9 (mono), and complex degradation products or cleaved Sb9 (deg) are indicated by arrows.
(H) Fluorescence micrographs indicate that compound 3034 significantly increases the expression of LAMP1 (red) and expands the lysosomes. DAPI (blue) was the nuclei. Scale bar, 10 μm. See also Figure S4.
