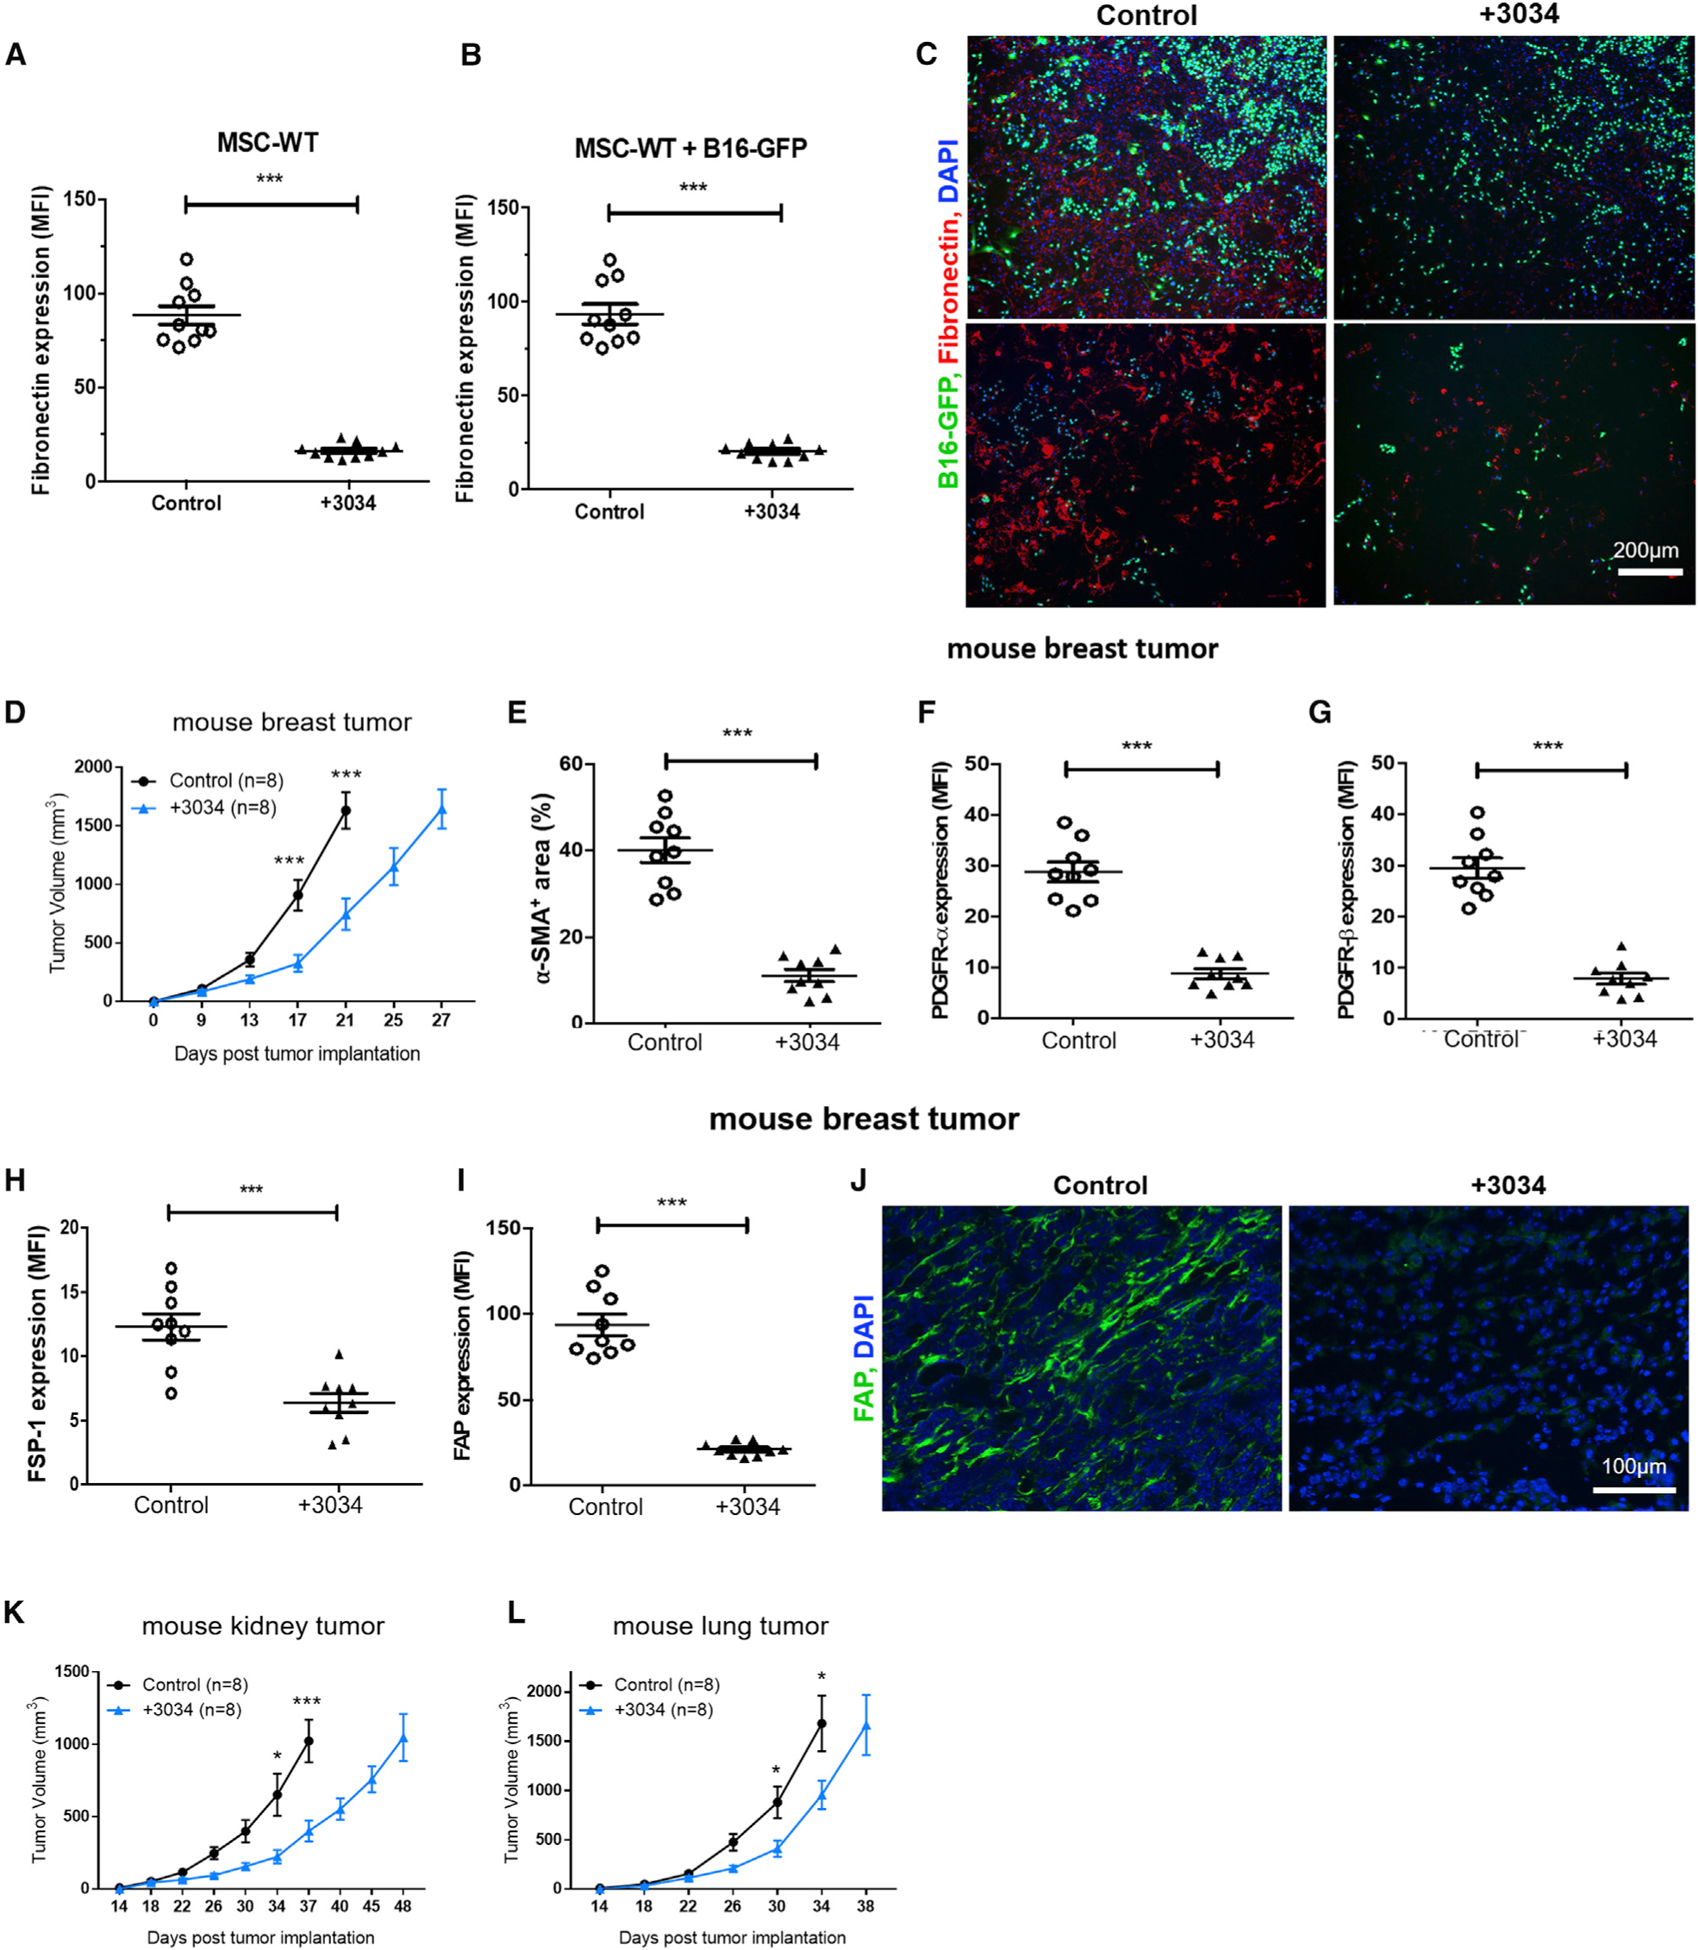
Figure 6. Treatment with an Sb9 Inhibitor Restrains Breast Tumor Growth In Vivo.

(A) Semiquantitative analysis of fluorescence micrographs show that compound 3034 reduces the production of ECM fibronectin by MSC-WT cells significantly.***p < 0.001.
(B and C) Representative fluorescence micrographs (C) and semiquantitative analysis (B) show that compound 3034 decreases significantly the expression of ECM fiber fibronectin by MSC-WT cells following co-culture with B16-GFP cells. ***p < 0.001. Scale bar, 200 μm.
(D) Tumor growth curve shows significantly slower growth of 4T1 tumors in BALB/c mice treated with compound 3034 (300 μg i.p. bid for 14 days following implantation) (n = 8) than the control treated with 10% DMSO (n = 8). ***p < 0.001.
(E–I) Semiquantitative analysis of fluorescence micrographs shows significantly lower expression (MFI) of cancer-associated fibroblast (CAF) markers α-SMA (E), PDGFRα (F), PDGFRβ (G), FSP-1 (H), and FAP (I) in breast tumor sections from the 3034-treatment group in comparison to the control group (10% DMSO) at day 17 post-implantation. ***p < 0.001.
(J) Representative fluorescence micrographs show significantly lower expression of cancer-associated fibroblast (CAF) marker FAP (green) in breast tumor sections from the compound 3034 treatment group in comparison to the control (10% DMSO) at day 17 post-implantation. DAPI (blue) was the nuclei. Scale bar, 100 μm.
(K) Tumor growth curve demonstrates significantly slower growth of Renca mouse kidney tumors in male BALB/c mice treated with compound 3034 (300 μg i.p. bid for 21 days following implantation) (n = 8) than the control treated with 10% DMSO (n = 8). *p < 0.05, ***p < 0.001.
(L) Tumor growth curve demonstrates significantly slower growth of LLC1 mouse lung tumors in C57BL/6 WT mice treated with compound 3034 (300 μg i.p. bid for 21 days following implantation) (n = 8) than the control group treated with 10% DMSO (n = 8). *p < 0.05. See also Figure S6.
