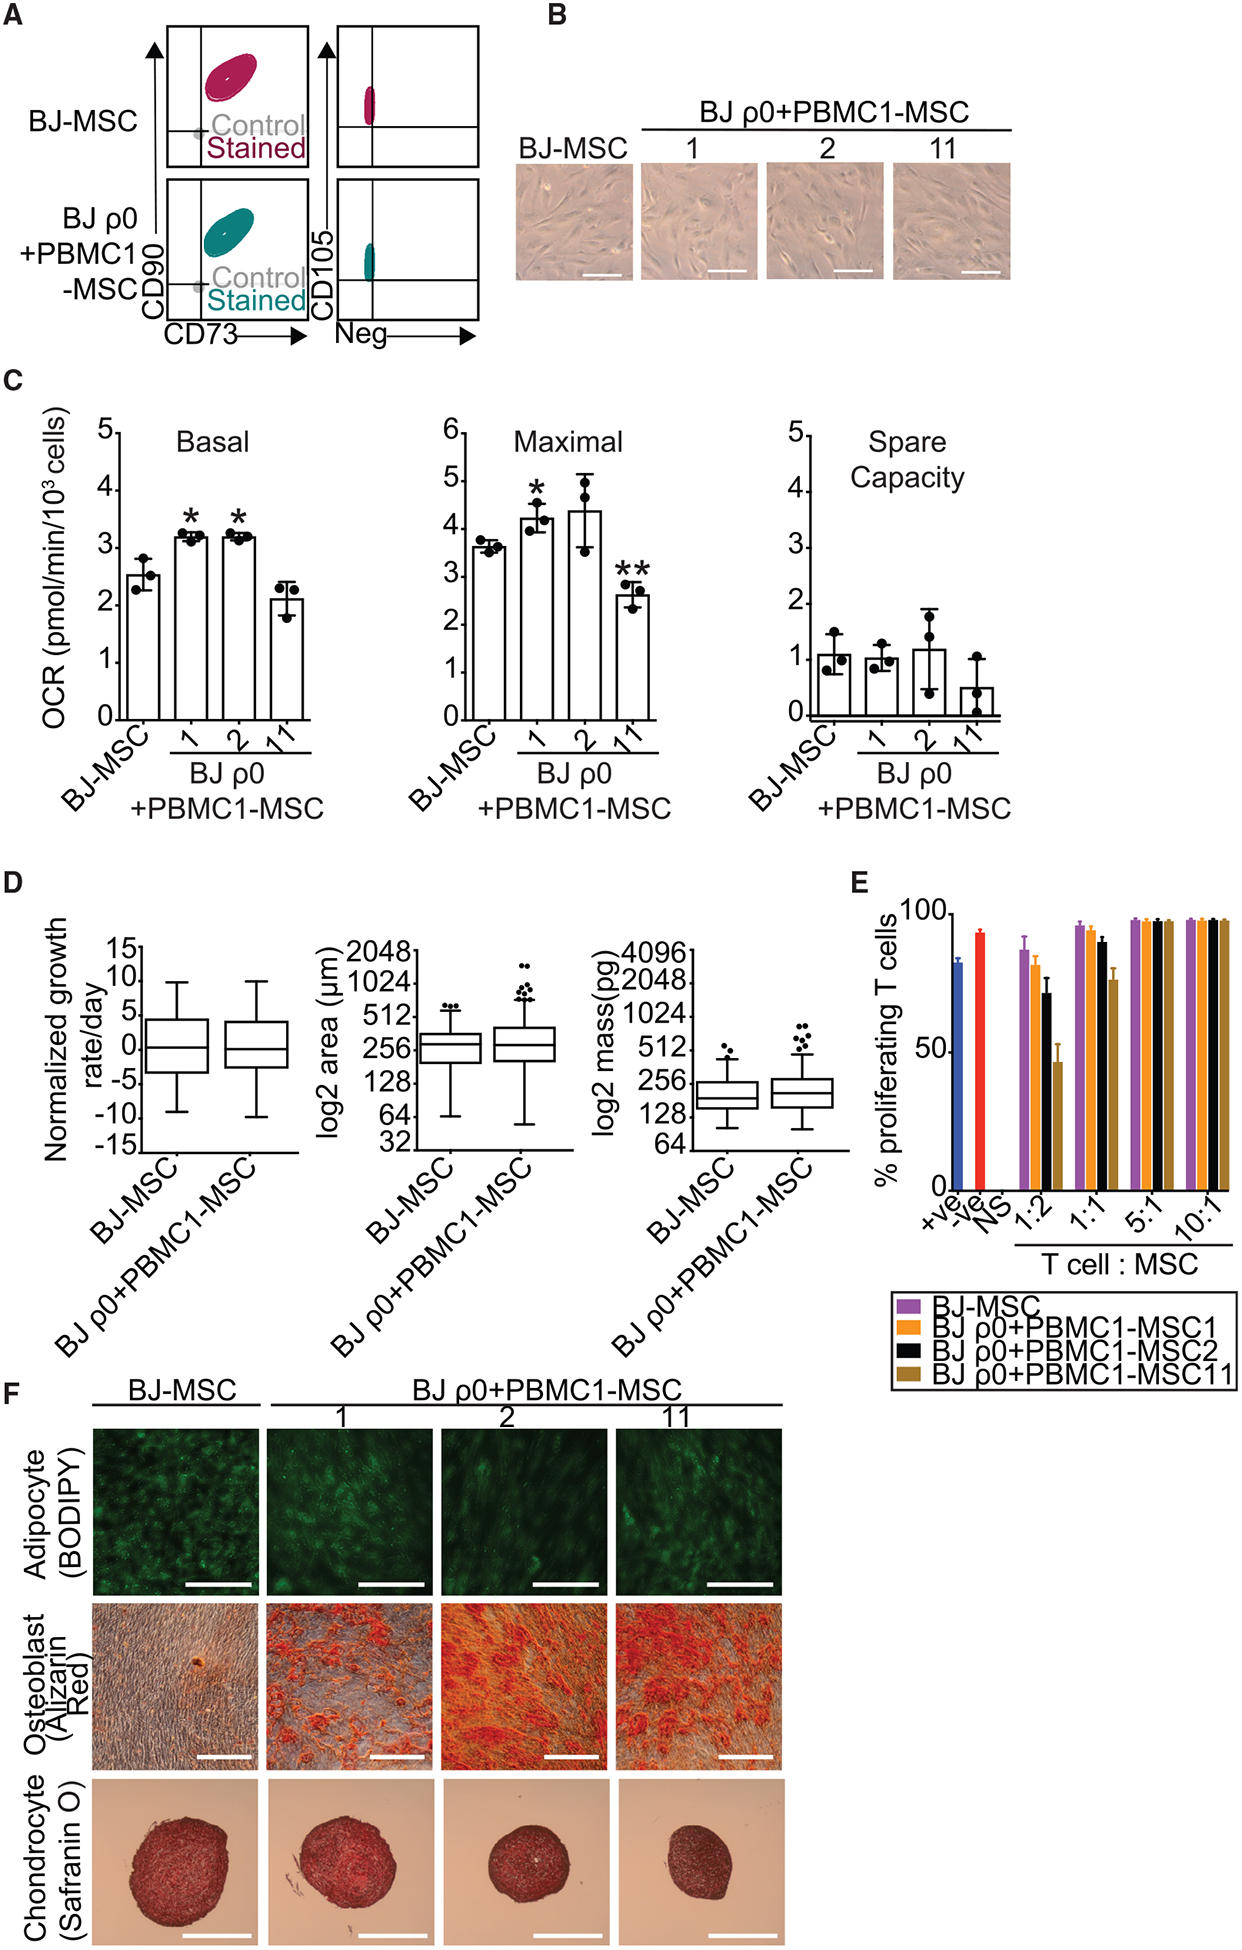
Figure 4. SIMR iPSCs Produce MSCs with Trilineage Differentiation Potential.

(A) Flow cytometry of MSC biomarkers CD73, CD90, and CD105, and a cocktail of negative MSC biomarkers. Immunostained samples are indicated in color, with isotype negative controls in gray. Data for BJ-MSC control are the same data as in Figure S5A. Representative clones for native BJ-MSCs and BJ ρ0+PBMC1-MSCs are indicated.
(B) Bright-field microscopy showing unmanipulated BJ-MSC and BJ ρ0+PBMC1-MSC clones 1, 2, and 11 adhering to plastic at 203 magnification (scale bars, 100 mm). Data for BJ-MSC control are the same data as in Figure S5B.
(C) OCR measurements for ~1.5 × 10⁴ native BJ-MSCs and BJ ρ0+PBMC1-MSC clones 1, 2, and 11. Data for BJ-MSC control are the same as in Figure S5C. Data are the means ± SD of three technical replicates. Statistical significance by unpaired, two-tailed Student’s t test. *p ≨ 0.05; **p ≨ 0.01.
(D) Quantitative phase microscopy of native BJ-MSCs and a 1:1:1 mix of BJ ρ0+PBMC1-MSC clones 1, 2, and 11. Data for BJ-MSC control are the same as in Figure S5D. Shown are box-and-whisker Tukey plots with outliers identified. Data were averaged from 77 and 172 cells for native BJ-MSCs and BJ ρ0+PBMC1- MSCs, respectively. Statistical significance by Welch’s t test.
(E) T cells were added into native BJ-MSC or BJ ρ0+PBMC1-MSC clone 1, 2, or 11 cultures at 1:2, 1:1, 5:1, and 10:1 T cell:MSC ratios. After 5 days of co-culture, T cell proliferation was measured using a CFSE dye dilution assay by flow cytometry. The data labeled “NS” (no stimulus) denote T cells without CD3/CD28 bead activation. The data labeled “-ve” (negative) denote no addition of MSCs to stimulated T cells. The data labeled “+ve” (positive) denote a 1:1 addition of myeloid-derived suppressor cells to T cells. Data are the means ± SD of three technical replicates.
(F) Trilineage differentiation of native BJ-MSCs and BJ ρ0+PBMC1-MSC clones 1, 2, and 11. Representative sections were fixed and stained with 1 μM Bodipy 493/503, 1% alizarin red S, and 0.1% Safranin O, respectively. Shown are adipocytes (first row, 20×; scale bars, 100 μm), osteocytes (second row, 20×; scale bars, 200 μm), and chondrocytes (fourth row, 5×; scale bars, 500 μm).
See also Figure S1.
