FIGURE 1:
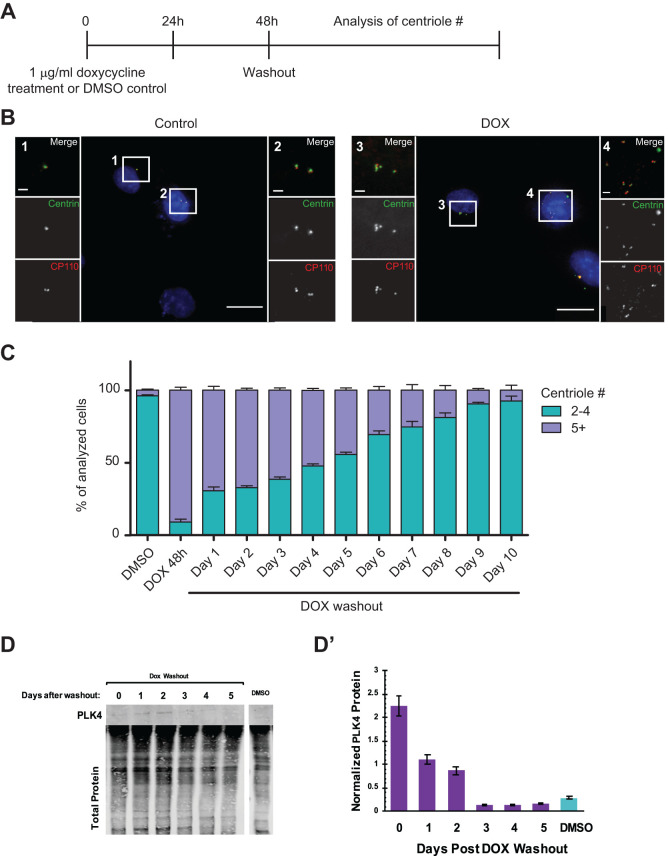
Centriole number returns to normal after initial amplification. (A) Schematic representation of experimental treatment of hTERT-RPE-1 GFP-centrin-2 tetON-Plk4 cells. Cells were treated with 1 μg/ml doxycycline or 1:1000 (vol/vol) DMSO for 48 h. Drugs were subsequently washed out, and cells were analyzed at time points afterward. (B) Representative images of hTERT-RPE-1 GFP-centrin-2 tetON-Plk4 DMSO-treated cells (Control, left) and doxycycline-treated cells (DOX, right). Cells were stained for CP110, and GFP-centrin-2 was visualized by endogenous fluorescence. Nuclear DNA was visualized with DAPI in the merged low-magnification image. In the merged insets, CP110 is shown in red and GFP-centrin-2 in green. Scale bar = 20 μm. Insets 1–4 show enlargements of the selected areas. Scale bar is 2 μm. (C) Centriole number over time after doxycycline washout. The graph shows calculated means from seven independent experiments with SEM (n ≥ 150 for each experiment). (D) Western blot of PLK4 and actin protein levels after washout of doxycycline or DMSO in hTERT-RPE-1 GFP-centrin-2 tetON-Plk4 cells. (D’) Quantification of D. PLK4 is normalized to total protein. Error bars represent the SEM from two independent experiments.

