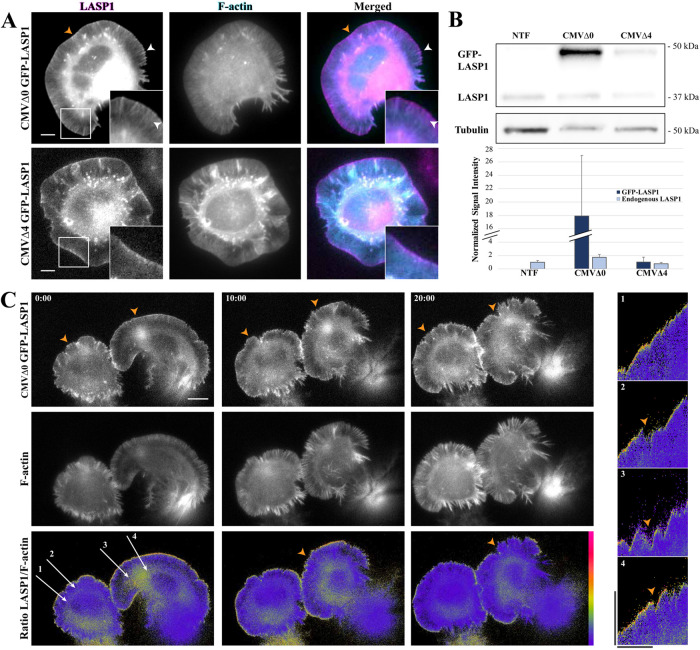
FIGURE 2:
GFP-LASP1 localizes to protruding membranes. (A) Representative images of live CAD cells coexpressing intact (CMVΔ0 GFP-LASP1, top) or crippled (CMVΔ4 GFP-LASP1, bottom) CMV promoter-driven GFP-LASP1 (left, magenta), along with Lifeact-mRuby (F-actin, middle, cyan). GFP-LASP1 overexpressed by an intact CMV promoter localizes to the leading edge (orange arrowheads) and actin bundles (white arrowheads), whereas CMVΔ4 GFP-LASP localizes only to the leading edge, similar to endogenous LASP1. Scale bars: 5 µm. (B) Top, representative anti-LASP1 and anti-tubulin Western blots from CAD cells transfected with CMVΔ0 GFP-LASP1 or CMVΔ4 GFP-LASP1, along with nontransfected controls (NTF). Bottom, graph shows quantification of GFP-LASP1 expression, normalized to tubulin loading control, with endogenous LASP1 from the nontransfected condition set to 1. Error bars represent standard error. (C) Time-lapse images of CAD cells coexpressing CMVΔ4 GFP-LASP1 and Lifeact-mRuby. Bottom row, images show GFP to mRuby ratio, color coded with a rainbow heat map (scale to right). Images were captured every 5 s for 20 min. Scale bar: 10 µm. Right, representative kymographs (correspond to labeled arrows on left merged image). High levels of GFP-LASP1 can be found at the leading edge during cell protrusion, but GFP-LASP1 largely disappears from the edge on cell retraction (orange arrowheads). Images are representative of 10 cells across three independent culture replicates. Kymograph scale bars: vertical is 10 µm, horizontal is 10 min.

