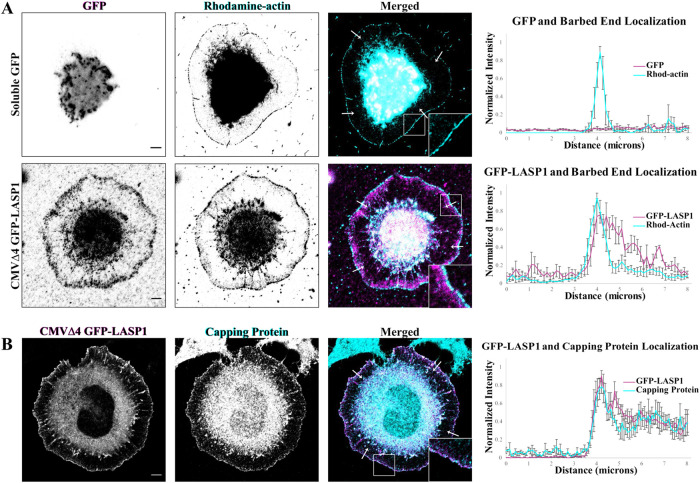
FIGURE 4:
LASP1 localizes to actin plus ends at the leading edges of CAD cells. (A) Representative images of CAD cells expressing soluble GFP or CMVΔ4 GFP-LASP1 (magenta), with actin plus ends labeled with rhodamine–conjugated actin (cyan). Scale bars: 5 µm. Graphs (right) depict the average of four normalized line profiles from cells on left (arrows in merged images show location of line scans). Error bars represent standard error. LASP1 localization at the leading edge overlaps with the labeled plus ends. Representative of 10 cells from three independent culture replicates. (B) Representative images showing colocalization of CMVΔ4 GFP-LASP1 (magenta) and endogenous CP in CAD cells (cyan). Scale bar: 5 µm. Graph (right) shows the average of four normalized line profiles from arrows in merged image. Error bars represent standard error.

