FIGURE 7:
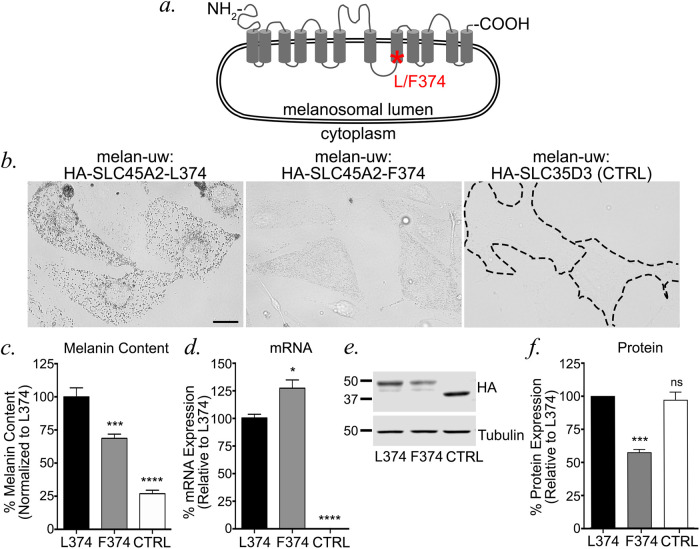
The human light skin-associated SLC45A2-F374 variant is expressed in melanosomes at lower levels than the dark variant. (a) Schematic diagram of human SLC45A2 primary structure, with transmembrane (gray cylinders) and luminal and cytosolic domains (gray lines) indicated. An asterisk indicates the position of L/F374. (b) Stably transfected melan-uw cells expressing HA-SLC45A2-L374 (left), HA-SLC45A2-F374 (center), or HA-SLC35D3 as a negative CTRL (right) were imaged by BF to emphasize pigmentation levels. Bar, 10 μm. (c–f) Stably transfected melan-uw cells expressing HA-SLC45A2-L374, HA-SLC45A2-F374, or HA-SLC35D3 (CTRL) were analyzed for (c) melanin content by quantitative spectroscopy assay, (d) SLC45A2 mRNA expression by quantitative RT-PCR, or (e, f) HA protein expression by immunoblotting relative to tubulin as a loading CTRL. A representative immunoblot is shown in e; quantification of HA expression normalized to tubulin levels over three experiments is shown in f. All values are normalized to 100% for cells expressing HA-SLC45A2-L374. Each experiment was repeated at least three times. Statistical analyses were determined by Welch’s ANOVA with Dunnett T3 test for multiple comparisons (c, d) or one-way ANOVA with Dunnett’s test for multiple comparisons (f).*p < 0.05; ***p < 0.001; ****p < 0.0001; ns, no significant difference.

