FIGURE 3:
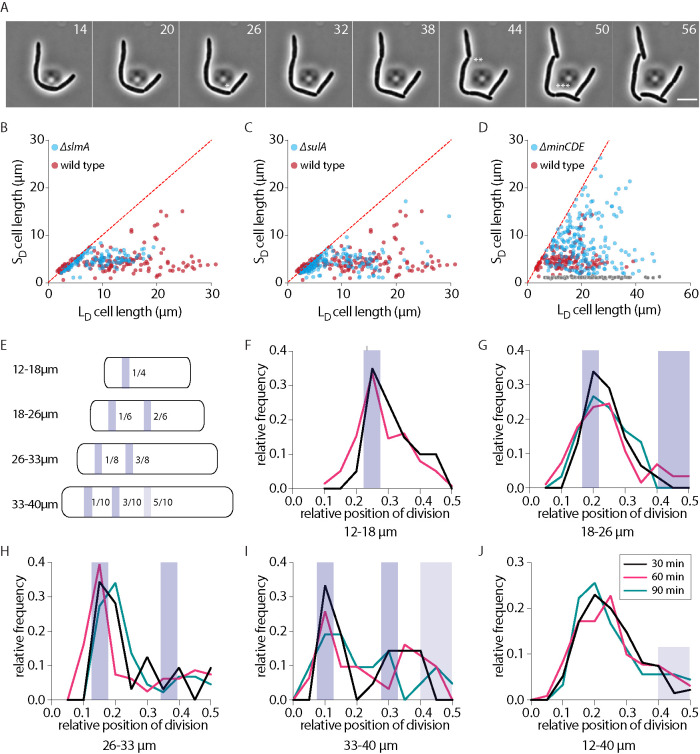
Role of Min-system in division positioning. (A) Representative time-lapse montage of division in wild-type cells during damage recovery. (B–D) Cell length of long daughter (LD) and short daughter (SD) generated from a DNA damage-induced filament during recovery for slmA (n = 144), sulA (n = 246), and minCDE (n = 186) backgrounds, respectively (blue dots; minicells are shown in gray). As a reference, lengths for wild type (n = 137) during recovery are shown in red. The red line plots the expected values if all cells were dividing at their midpoint. (E) Schematic representation of the Min-driven division site rule (figure adapted from Wehrens et al., 2018). Location of division for various filament length bins is shown with the blue band. Precise location of division (relative to cell length) is depicted inside each cell. (F) Distribution of relative position of division for filaments between 12 and 18 µm for 30 or 60 min of damage treatment. Data are not shown for 90 min of treatment as the number of filaments in this length range in 90 min treatment is low. Location of division as determined by the Min-rule is shown as a shaded bar. (G–I) As F for filaments between 18 and 26, 26 and 33, and 33 and 40 µm, respectively. (J) As F for all filaments between 12 and 40 µm. Location of potential midcell division is shown with the shaded bar (n [all] = 135 [30 min], 453 [60 min], 95 [90 min]).

