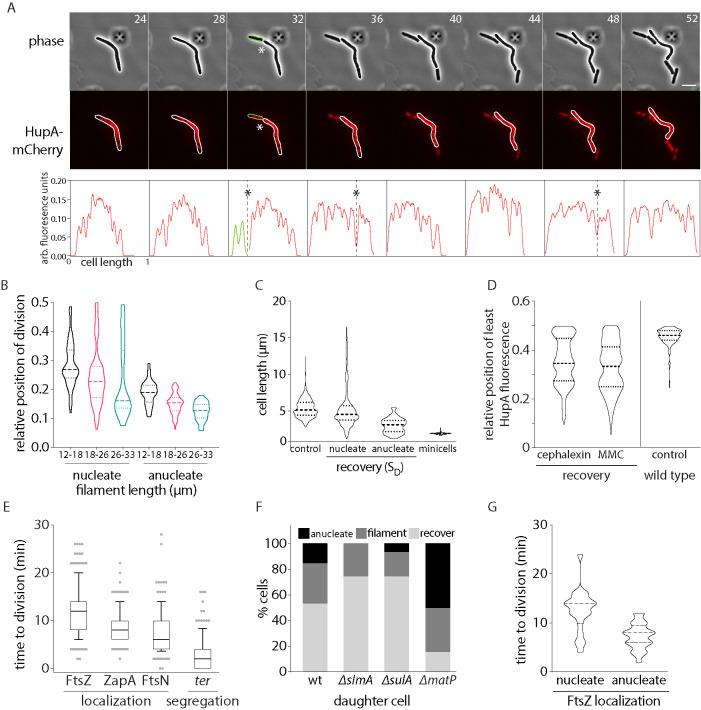
FIGURE 4:
Impact of chromosome and terminus segregation on division regulation. (A) Representative time-lapse montage of division in cells during recovery. Gray: phase; red, HupA-mCherry (chromosome); scale bar = 5 µm; time in minutes. Fluorescence intensity traces for the cell in montage is provided below. Division sites are marked with “*”. (B) Distribution of relative position of division for filaments between 12 and 18, 18 and 26, and 26 and 33 µm is plotted for nucleate and anucleate (from wild-type and matP backgrounds) divisions (n = 398 [nucleate] and 160 [anucleate]). (C) Cell length distribution for wild-type cells (no perturbation) is plotted. Along with this, cell length distribution of SD during DNA damage recovery is plotted for nucleate cells and anucleate cells. To highlight the distinction between these cell division events and minicell formation, cell length distribution of minicells (from min-deleted cells) is also shown. (n = 1110 [control], 531 [nucleate SD], 41 [anucleate SD], 117 [minicells]). (D) Position of least intensity of HupA fluorescence (gaps between chromosomes) plotted as a function of cell length (from one pole to midcell) in recovering MMC or cephalexin-treated filaments. As reference, these data are also shown for wild-type cells with no damage treatment (control; n = 191 [cephalexin], 476 [MMC], 150 [control]). (E) Distribution of time to division after FtsZ, ZapA, and FtsN localization to division site is plotted. Along with this, time to division after segregation of terminus (ter) during recovery after MMC treatment is also shown (n = 103 [FtsZ], 102 [ZapA], 127 [FtsN], 123 [ter]). (F) Percentage of SD that are anucleate, recover, and filament is plotted for wild type and deletions of slmA, sulA, and matP, during DNA damage recovery (n = 103 [wild type], 105 [slmA], 105 [sulA], 103 [matP]). (G) Time from FtsZ localization to division completion is plotted for divisions that result in nucleated or anucleated SD cells (n = 231 [nucleate], 71 [anucleate]).

