FIGURE 2:
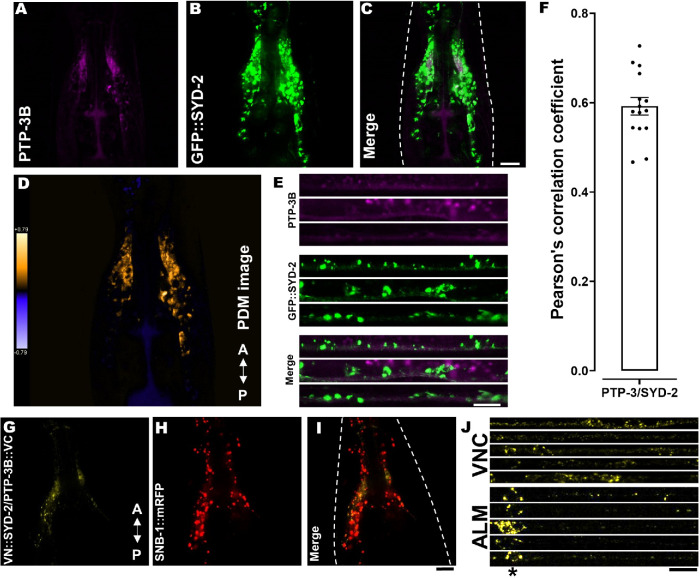
SYD-2/PTP-3B colocalization and BiFC analysis. (A–E) PTP-3B::CFP (pseudo-colored in magenta) and GFP::SYD-2 colocalization in nerve rings (A–D) and VNCs (E). (D) Pseudo-color PDM image (see Materials and Methods) indicating quantifiable colocalization between SYD-2 and PTP-3B in the nerve ring. (F) Pearson’s correlation coefficient quantification of data shown in C. (G) Positive PTP-3B/SYD-2 BiFC signal in the nerve ring of living worms indicating that SYD-2 and PTP-3B are at least 7–10 nm close to each other (see Materials and Methods). (H) Worm expressing SNB-1::mRFP under a pan-neuronal promoter. (I) Merged image from G and H. (J) Stacks of straightened VNCs and ALM neurons with positive PTP-3B/SYD-2 BiFC signals. *Location of somata in ALM neurons. Dotted, white line marks the contour of the worm head. Scale bars: 10 µm. N = 10 worms in F. Error bar: ± max. and min. range. A indicates the anterior direction and P the posterior direction. For BiFC-positive and -negative controls, refer to Supplemental Figure S3, C and D.

