
Figure 4. Percentage of participants prescribed diuretics by treatment arm at each time point.
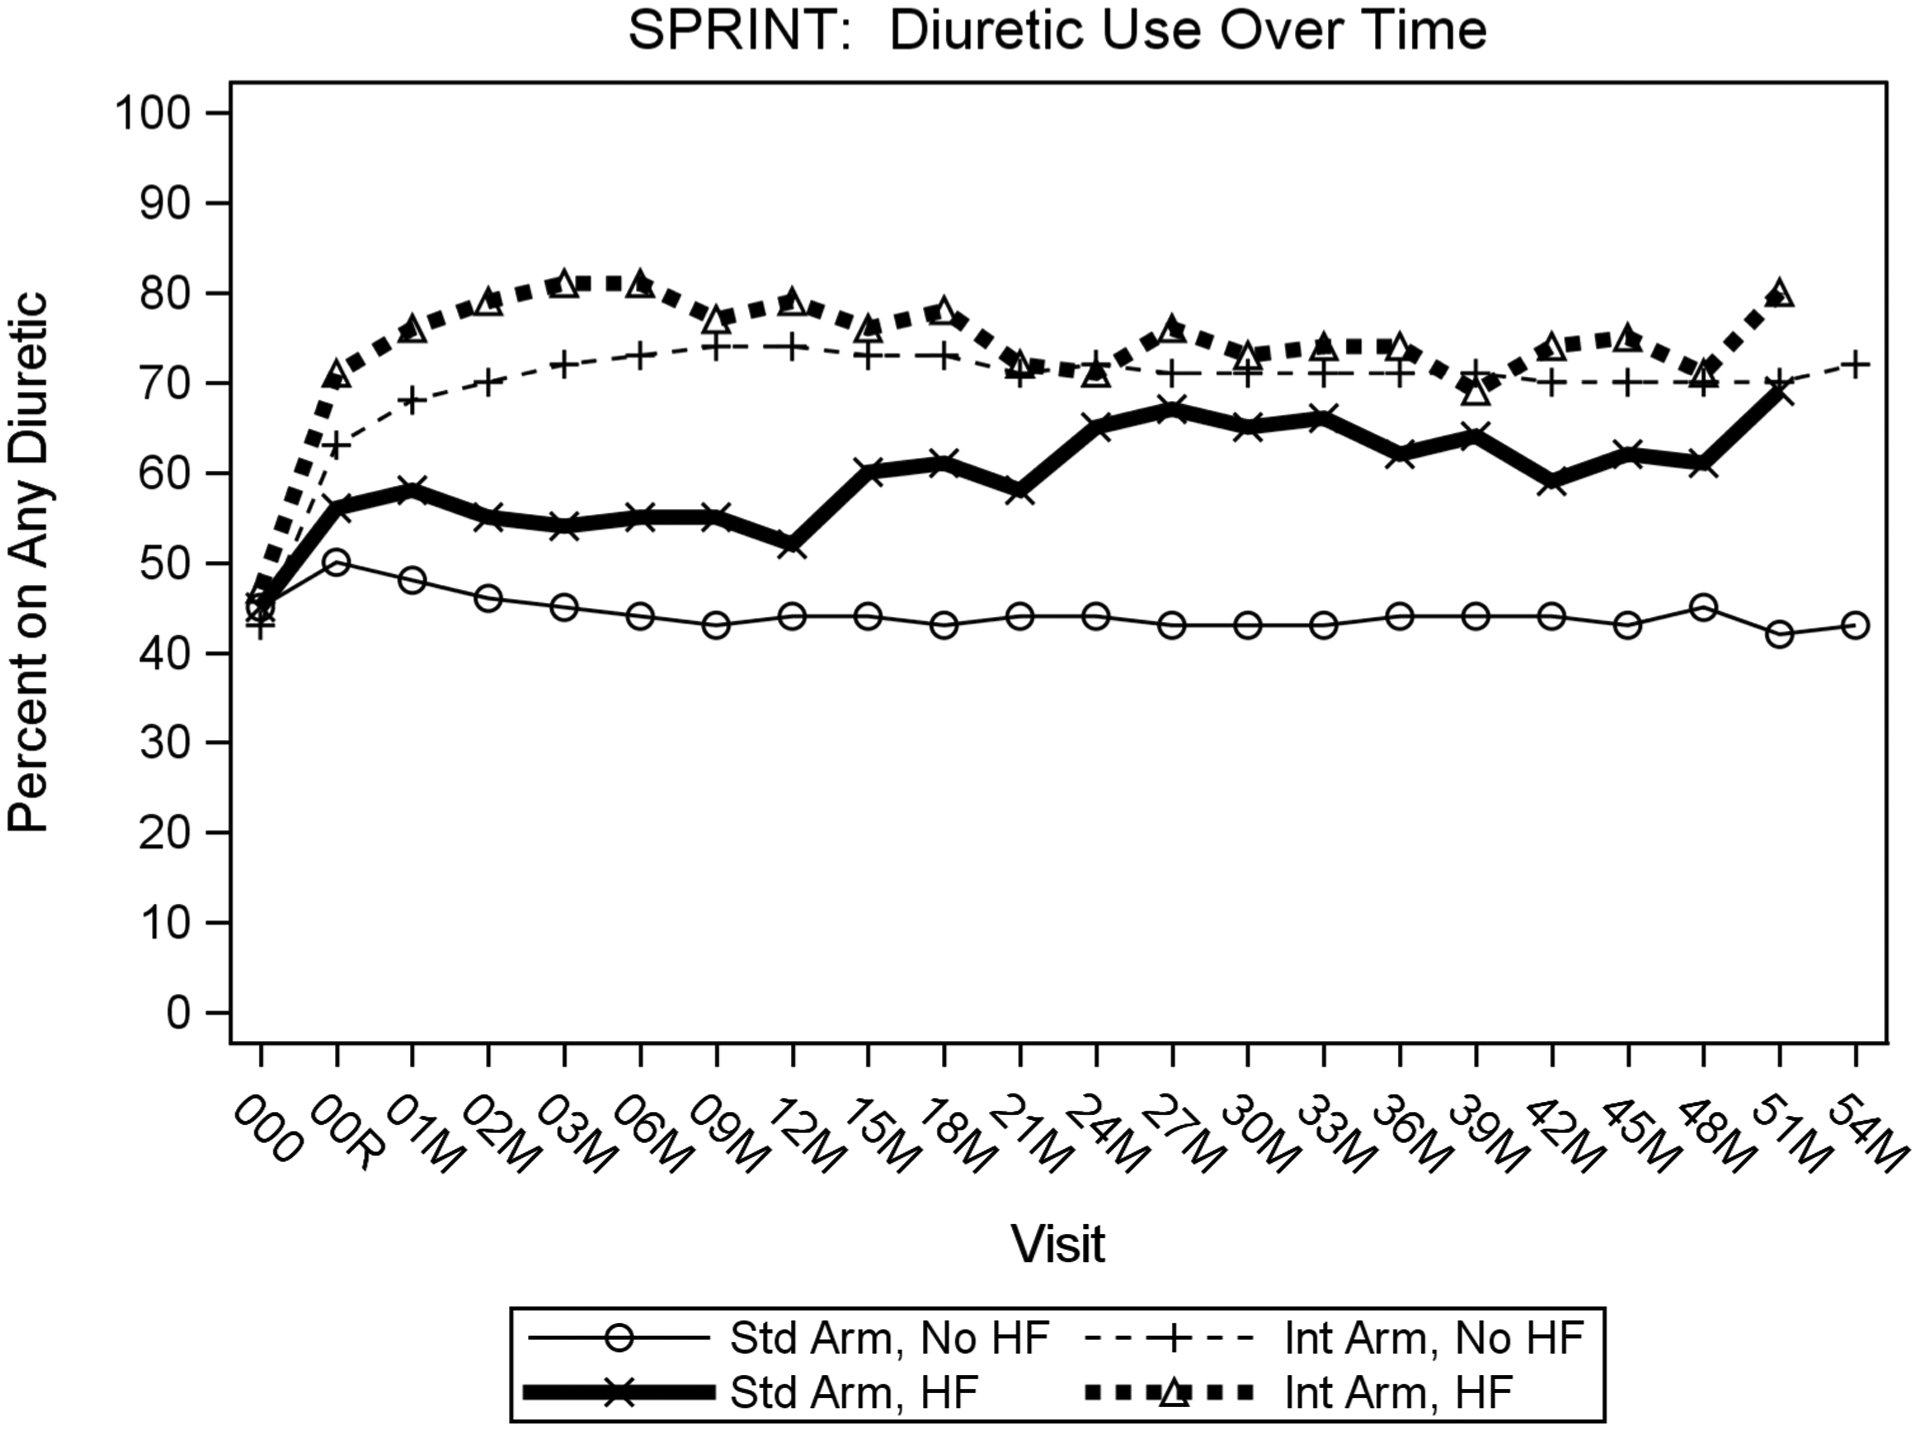
X-axis shows visit number in months; Y-axis shows percentage of participants prescribed any diuretic. Plot depicts four combinations of development of heart failure and treatment arm