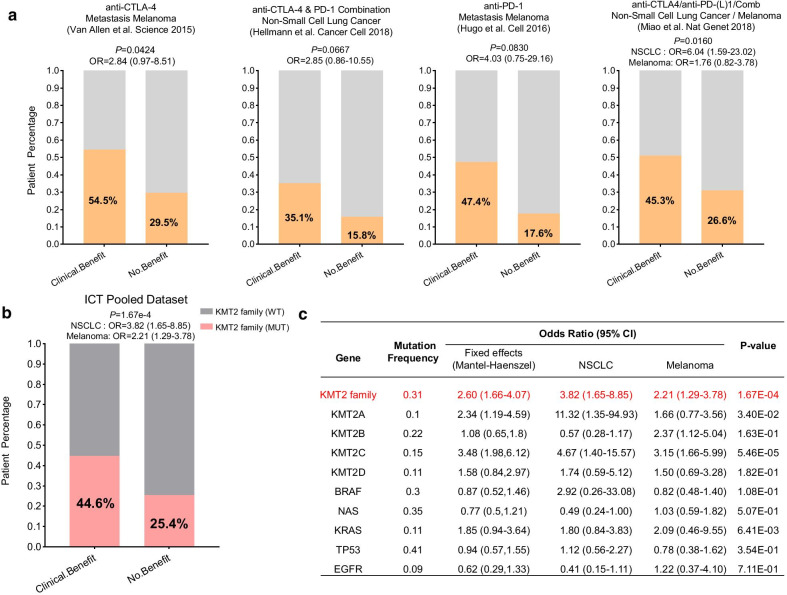
Fig. 2.
KMT2 family mutations in the baseline tumor tissue correlate with favorable responses to ICT. a Histogram depicting proportions of harboring KMT2 family mutations in clinical benefit and non-benefit groups of different ICT-treated patient cohorts. b Pooled estimates of odd ratios of KMT2 family mutation as a predictive marker for ICT, and c compared with other known predictive gene mutations. The individual odds ratio of the pooled dataset was calculated based on the Mantel–Haenszel model, and the P value was determined by Fisher's exact test

