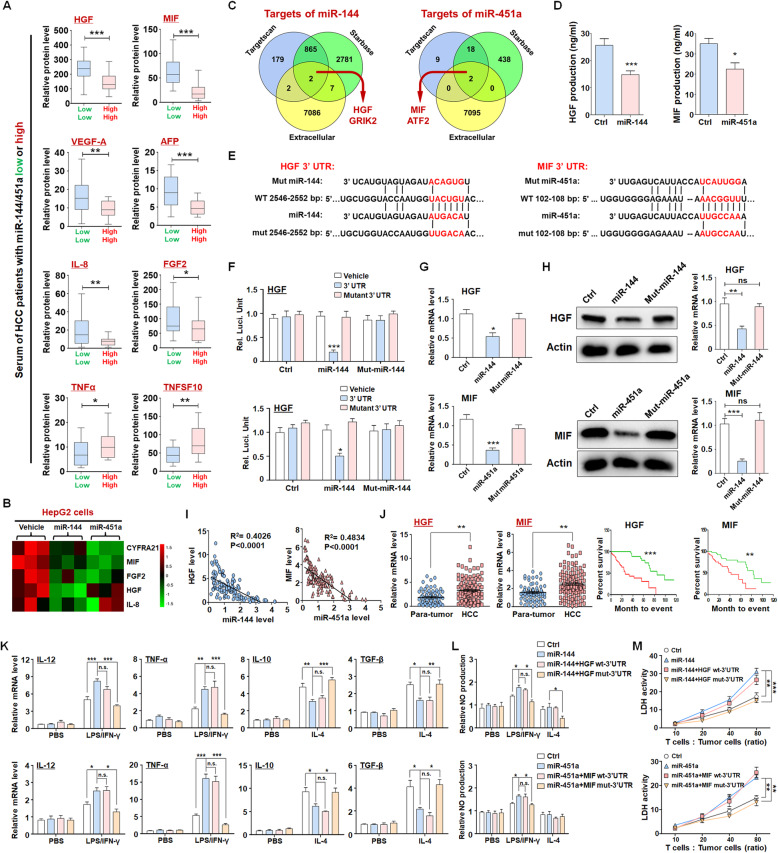
Fig. 3.
miR-144/miR-451a regulate macrophage polarization by targeting HGF and MIF in HCC cells. a, b The abundances of secreted cytokines were determined by cytokine antibody array using sera of HCC patients (a) (n = 36) and supernatant of control HCC cells or those overexpressing miR-144 or miR-451a (b) (n = 3). c The targets of miR-144 or miR-451a were predicted using different online tools and classified according to the protein subcellular localization. The extracellular target proteins were selected. d The production of HGF and MIF was detected in control and miR-144/miR-451a-overexpressing HepG2 cells using ELISA (n = 5). e Bioinformatic prediction identified HGF as a target of miR-144 and MIF as a target of miR-451a. f Reporter assay was performed to validate that miR-144 inhibited luciferase expression from a construct harboring a 3’UTR of HGF or MIF (n = 6). g, h Hepa1–6 cells were subjected to lentivirus-mediated overexpression of miR-144 or seed sequence-mutated miR-144/miR-451a, followed by qRT-PCR (g) and Western blot (h) analyses for the expression of HGF or MIF (n = 6). i The correlation between the levels of HGF mRNA and miR-144 or the levels of MIF and miR-451a in clinical HCC samples was analyzed (n = 125). j Paired clinical para-tumor and HCC tissues were used to determine the levels of HGF and MIF via qRT-PCR (n = 125). HCC patients were grouped according to the levels of HGF or MIF in tumor tissues and were subjected to survival analysis (n = 125). k, l miR-144- or miR-451a-overexpressing Hepa1–6 cells were further modified to express HGF or MIF with WT 3’UTR or the miRNA-binding site-mutated 3’UTR, and the supernatant was prepared and used for culture of BMDMs. The expression of polarization markers (k) (n = 6) and the generation of NO (l) by BMDMs were determined. m BMDMs cultured in conditioned media as described in (k) were further cocultured with CD3+ T cells. The activated T cells were then cocultured with Hepa1–6 cells at different ratios of cell numbers. Bars, means ± SEMs; *, P < 0.05; **, P < 0.01; ***, P < 0.001

