FIGURE 4.
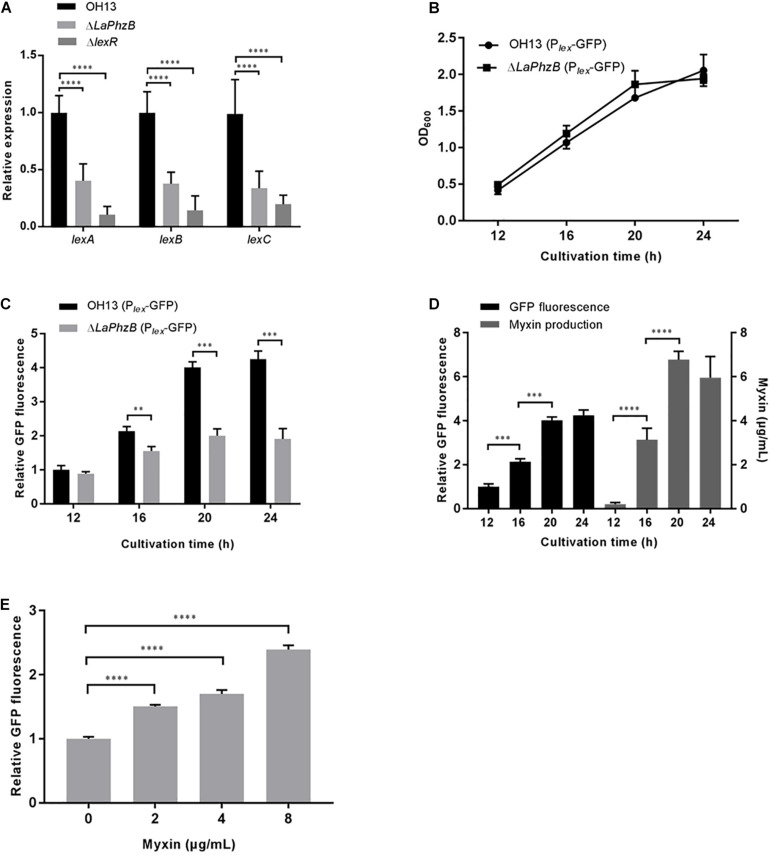
Expression of LexABC was stimulated by myxin. (A) qPCR analysis of lexA, lexB, lexC genes expression in strain OH13, ΔLaPhzB, ΔlexR strains. (B) Growth curves of strains OH13 (Plex-GFP) and ΔLaPhzB (Plex-GFP) cultured in 1/10 TSB for 12, 16, 20, and 24 h after inoculation. (C) Relative GFP fluorescence in strains OH13 (Plex-GFP) and ΔLaPhzB (Plex-GFP) at different time points. The fluorescence intensity in strain OH13 (Plex-GFP) at 12 h was normalized as 1. (D) Presentation of the relationship between myxin concentration and gene expression of lexABC. Data from Figures 3B,4C of strain OH13. (E) Relative GFP fluorescence in strain ΔLaPhzB (Plex-GFP) added with 0, 2, 4, 8 μg/mL myxin. The fluorescence intensity in strain ΔLaPhzB (Plex-GFP) without myxin was normalized as 1. Data shown in graph are the means from three replicates and error bars are standard deviations. Asterisks indicate statistically significant difference according to t-test in GraphPad Prism 7.0. ∗∗p < 0.01, ∗∗∗p < 0.001, ****p < 0.0001.

