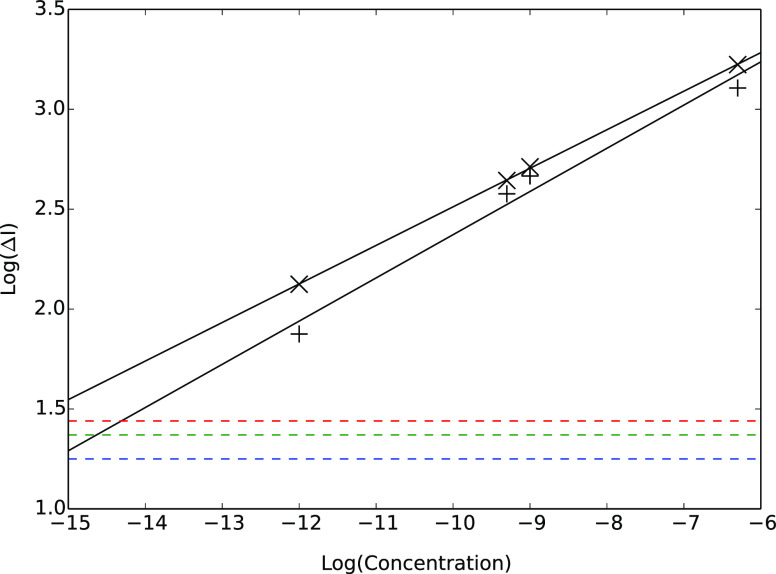
Figure 11.
Differences in SERS intensities at 2872 cm–1 (crosses) and 2912 cm–1 (plus sign) between silver nanoparticles treated with aptamer alone (A) at a given concentration vs those treated with aptamer plus protein (A + P) at the same concentration. Detection limits are obtained by analysis of baseline scatter in the 3650–4000 cm–1 region. Dotted horizontal lines indicate 99, 99.9, and 99.99% one-sided confidence intervals.

