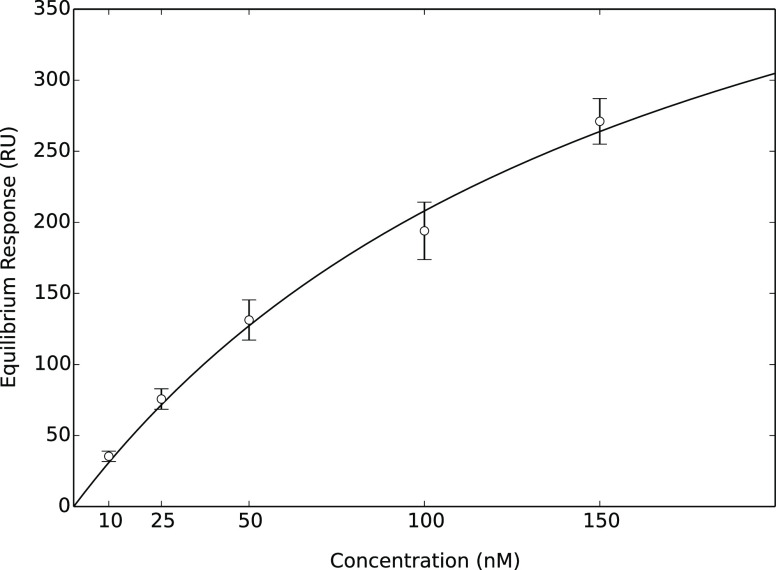
Figure 6.
Average extrapolated equilibrium SPR responses at 10, 25, 50, 100, and 150 nM spike protein concentrations. Error bars represent the 95% confidence interval of the mean, obtained by fitting five replicates independently but keeping rate constants for lower concentration samples fixed at the values obtained at 100 nM. The fitted Hill model is characterized by the parameters Req, max = 570 nM, EC50 = 174 nM and n = 1.

