
FIGURE 1.
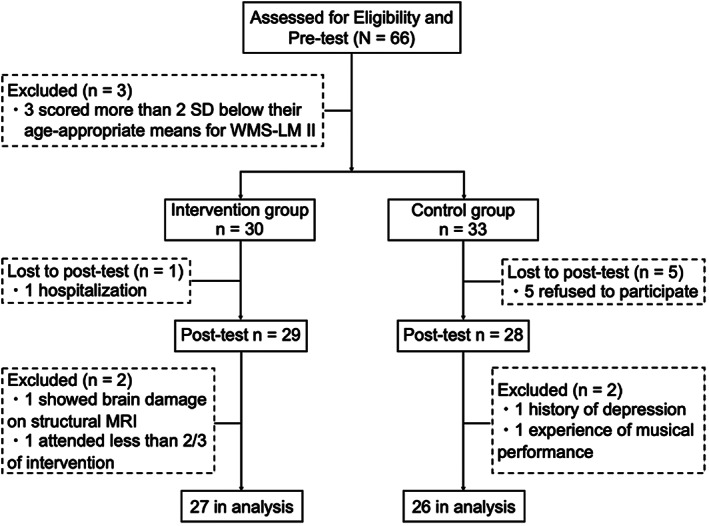
Study flow diagram. MRI, magnetic resonance imaging; SD, standard deviation; WMS‐LM II, Wechsler Memory Scale‐Revised Logical Memory II test
Official websites use .gov
A
.gov website belongs to an official
government organization in the United States.
Secure .gov websites use HTTPS
A lock (
) or https:// means you've safely
connected to the .gov website. Share sensitive
information only on official, secure websites.
Study flow diagram. MRI, magnetic resonance imaging; SD, standard deviation; WMS‐LM II, Wechsler Memory Scale‐Revised Logical Memory II test