
FIGURE 5.
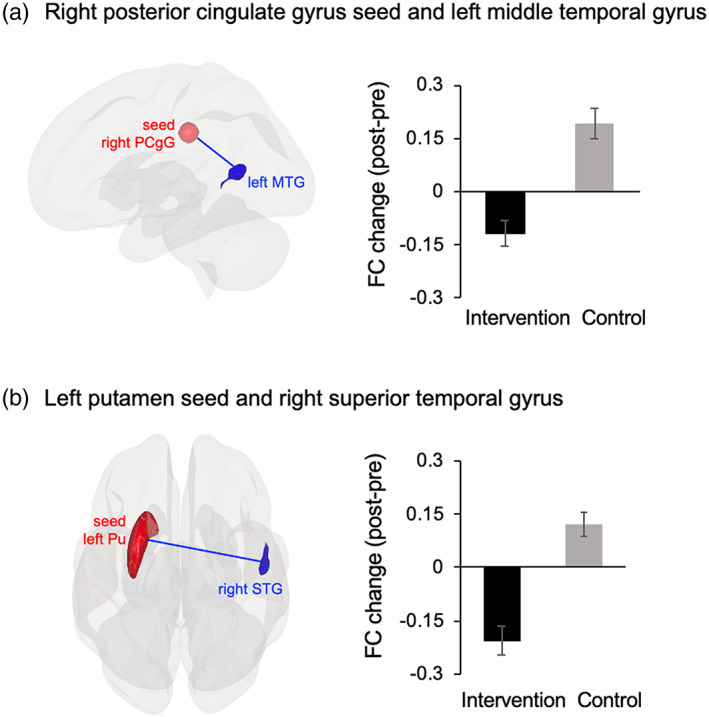
Results of the FC analysis. (a) Decreased rPCgG‐lMTG FC in the intervention group vs. the control group during the 1‐back task after the intervention. (b) Decreased lPu‐rSTG FC in the intervention group vs. the control group during the 1‐back task after the intervention. FC, functional connectivity; rPCgG, right posterior cingulate gyrus; lMTG, left middle temporal gyrus; lPu, left putamen seed; rSTG, right superior temporal gyrus