
FIGURE 6.
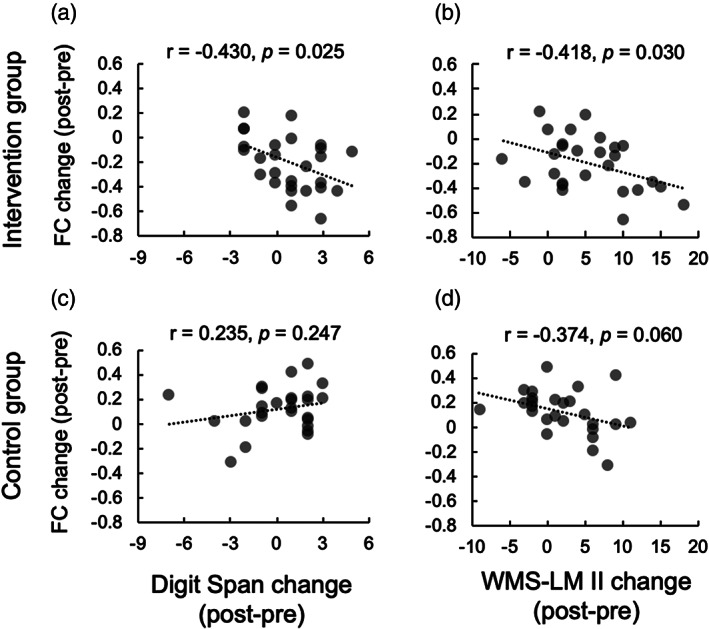
Correlation analyses between task‐related functional connectivity change and behavioral change. (a) lPu‐rSTG FC change during the 1‐back task was negatively correlated with Digit Span performance change in the intervention group. (b) lPu‐rSTG FC change during the 1‐back task was negatively correlated with WMS‐LM II performance change in the intervention group. (c) No significant correlation was found between lPu‐rSTG FC change and Digit Span performance change in the control group. (d) No significant correlation was found between lPu‐rSTG FC change and WMS‐LM II performance change in the control group. Although this effect was marginal, the coefficient did not surpass the adjusted α‐level threshold (|r| = 0.384) obtained in the permutation test. FC, functional connectivity; lPu, left putamen seed; rSTG, right superior temporal gyrus; WMS‐LM II, Wechsler Memory Scale‐Revised Logical Memory II