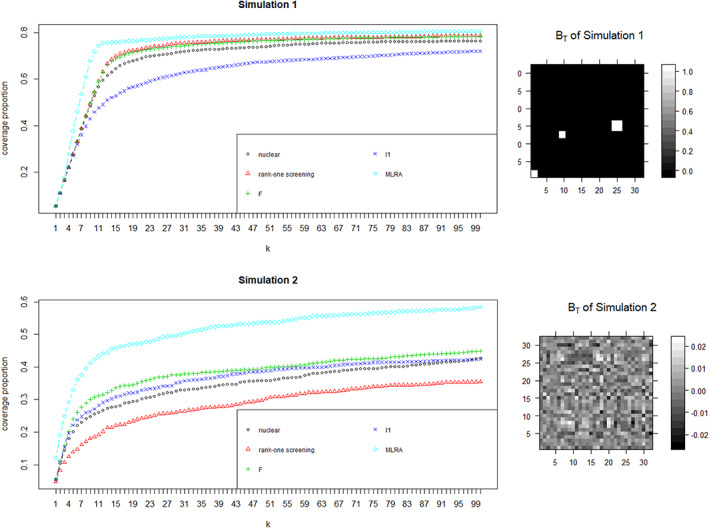
FIGURE 1.

Results on synthetic data. We present the result on synthetic data and the true images of BT used in simulations. We report the average true nonzero coverage proportion as k increases from 1:100. The result is averaged by repeating 100 times. It reveals that MLRA (light blue diamond) outperforms all other four methods. Moreover, the performance of MLRA is stable under different settings of coefficient matrix, while rank‐one screening (red triangle) performs poorly in Simulation 2
