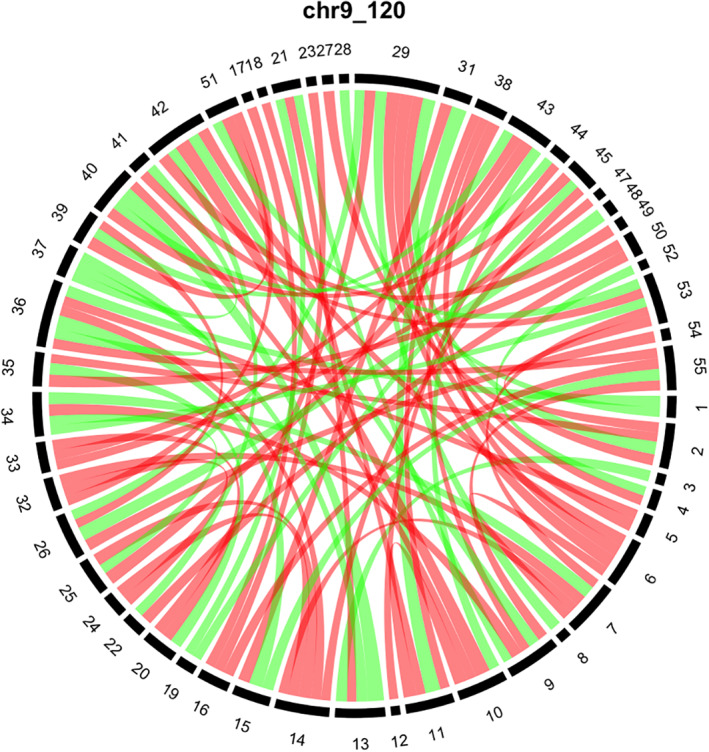
FIGURE 2.

The influence of the super‐variant on Chromosome 9 block 120 on brain connectivity. We standardize the elements of the connectivity matrices to mean 0 and variance 1. Individuals in the discovery set are separated into two groups according to the minor and major variants of the super‐variant on Chromosome 9 block 120. Here, the variant with a lower frequency is referred to as the minor variant. The difference matrix is calculated by subtracting the average connectivity matrix of the group with the major variant from the average connectivity matrix of the group with the minor variant. For visualization, only differences with absolute values in top 5% are plotted in the chord diagram. Red (green) bands indicate the negative (positive) differences and the widths of the bands indicate the magnitudes of the differences. The numbers in the outer circle indicate specific regions in the brain
