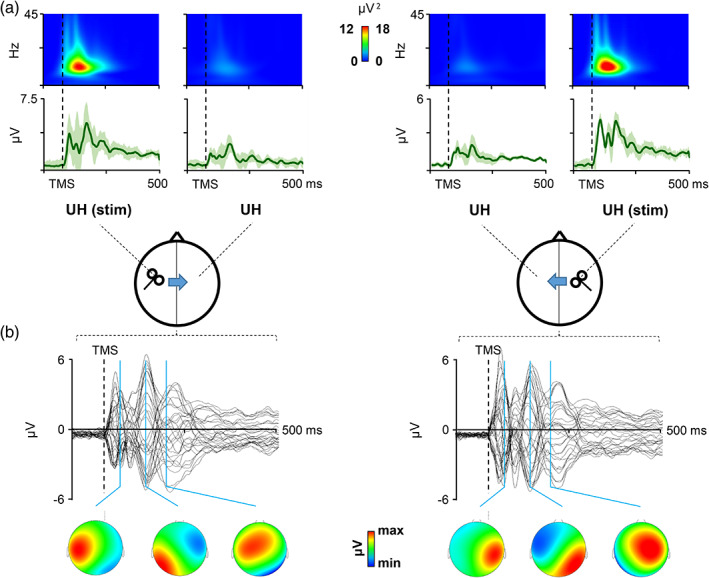
FIGURE 2.

Local and global transcranial magnetic stimulation (TMS)‐evoked cortical response after stimulation of the two hemispheres in healthy controls (HC). Panel (a): Local cortical response is displayed in terms of TMS‐evoked activity and cortical oscillations evoked over M1. Panel (b): Global cortical response is displayed in terms of TMS‐evoked potentials (TEPs) recorded over all the scalp with the scalp voltage distribution at the three main peaks of activity (20–40 ms, 40–70 ms, and 70–150 ms)
