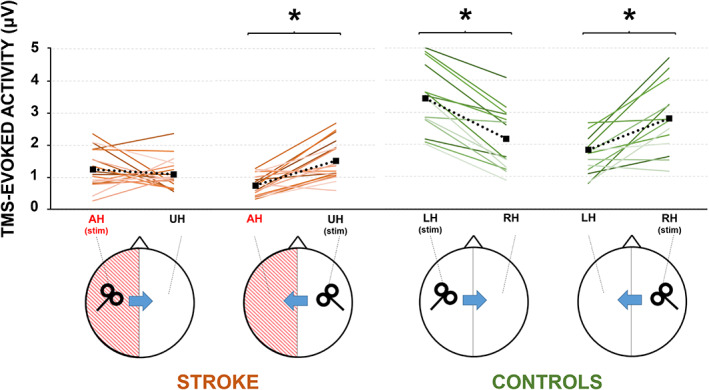
FIGURE 3.

Analysis of local transcranial magnetic stimulation (TMS)‐evoked cortical activity evoked from affected (AH) and unaffected (UH) M1 in stroke patients (brown lines) and left and right M1 in healthy controls (green lines). The plots depict the amplitude of the TMS‐evoked cortical activity evoked in the stimulated hemisphere and in the contralateral one for each single subject
