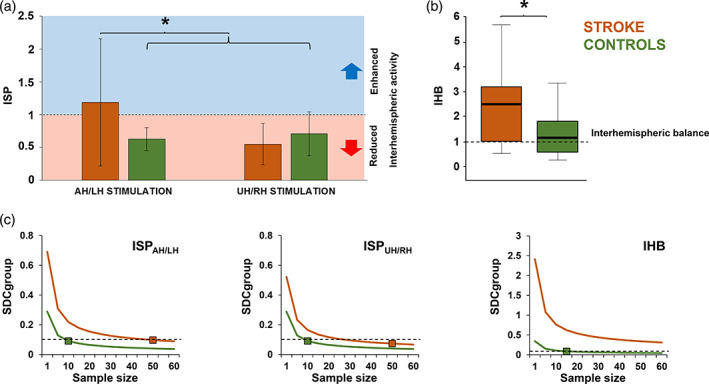
FIGURE 4.

Analysis of interhemispheric signal propagation (ISP) and interhemispheric balance (IHB). Panel (a): ISP amplitude after stimulation of left/affected hemisphere and right/unaffected hemisphere for stroke patients (brown bars) and healthy controls (green bars). Panel (b): IHB for stroke patients (brown bar) and healthy controls (green bar). IHB ≃ 1 indicates IHB (dotted line). Panel (c): Small detectable change at group level (SDCgroup) for ISP and IHB computed for an n sample size (1–60) of stroke patients. Brown and green squares indicate the sample size necessary to obtain an SDCgroup of less than 0.1 (dotted line)
