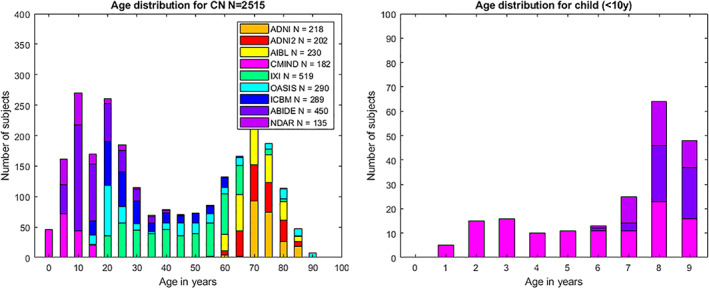
FIGURE 2.

Age distribution of cases used after quality control. Left chart shows age distribution for all the considered subjects. Right chart shows age distribution for child under 10 years old. Legend indicates the number of images for each data set after the quality control
