
FIGURE 4.
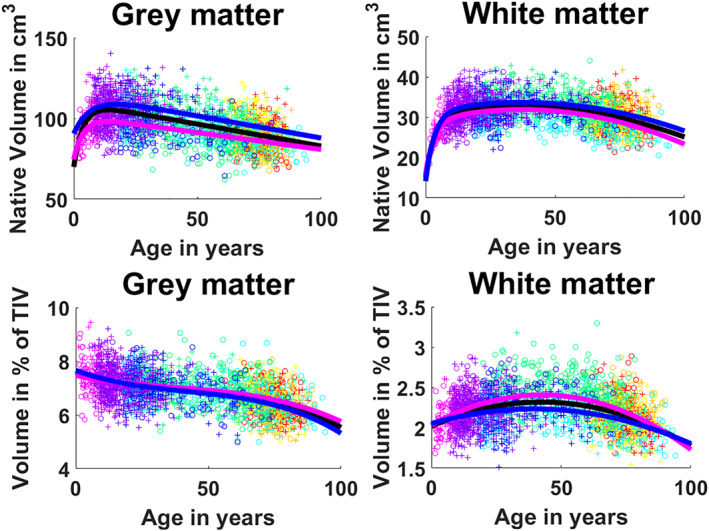
First row: Cerebellum gray matter and white matter trajectories for absolute values. Second row: Cerebellum gray matter and white matter trajectories for normalized values. General model is shown in black, female model in magenta and male model in blue. Dots color correspond to the different data sets used. Male cases are represented by “+”s and female cases are represented by “o”s