FIGURE 1.

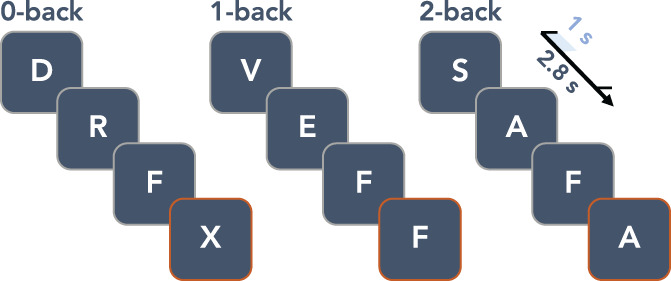
Illustration of the visual verbal n‐back paradigm. The inter‐trial interval was 2.8 s and stimuli were presented for 1 s on the screen. Target stimuli which required a response are highlighted with an orange border

Illustration of the visual verbal n‐back paradigm. The inter‐trial interval was 2.8 s and stimuli were presented for 1 s on the screen. Target stimuli which required a response are highlighted with an orange border