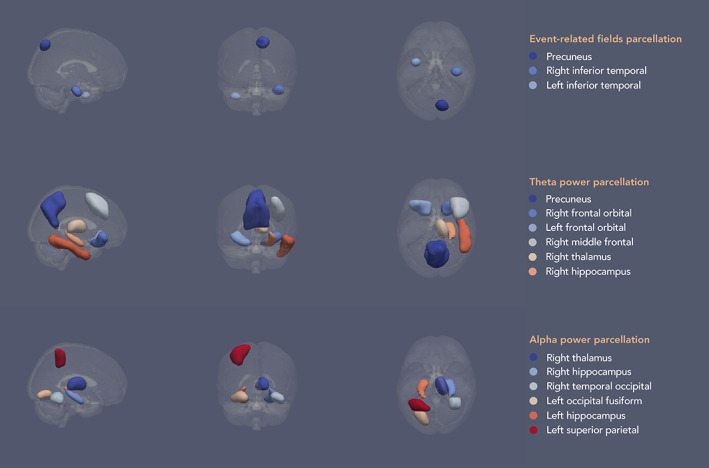
FIGURE 2.

Schematic of the parcellation atlases for the different analyses based on findings in healthy controls (Costers et al., 2020). The parcels in the schematic have been smoothed solely for illustrative purposes. Parcellation atlases using 5 mm3 voxels were used for the analyses
