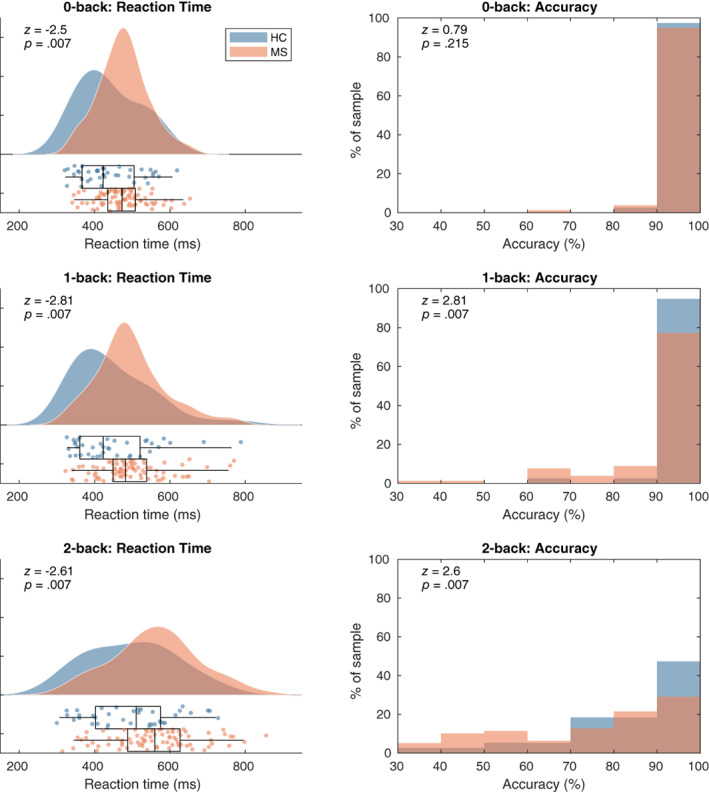
FIGURE 3.

Left panels: reaction time kernel density distribution and boxplots for the three WM load conditions. Right panels: histograms of accuracies per subject. The two groups did not significantly differ in reaction time or accuracy. ERF, event‐related field; HC, healthy controls; MS, multiple sclerosis patients
