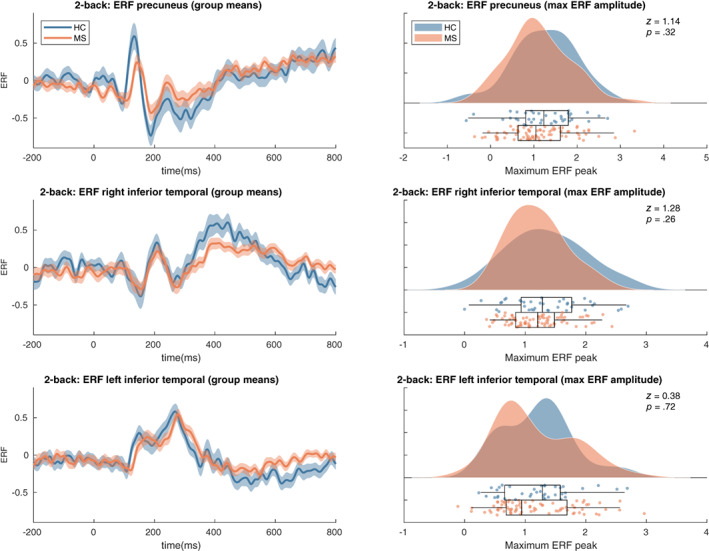
FIGURE 4.

Event‐related field results. Left panels: shaded error bars (using standard error) of group mean ERFs in the selected ROIs. Right panels: raincloud plot of distribution of the maximum peaks of ERFs in the selected ROIs. See Figure A1 for t‐statistics of the single group and group difference tests on the ERF timeseries. HC, healthy controls
