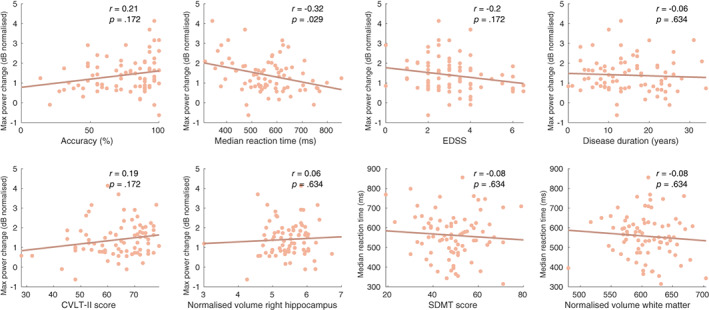
FIGURE 6.

Correlations between the maximum theta power change value in the right hippocampus and performance measures, clinical parameters and volumetric measurements in the MS sample. The last two figures (bottom right) display correlations between the median reaction time and SDMT score and normalised white matter volume. CVLT‐II, California Verbal Learning Test II; EDSS, Extended Disability Status Scale; SDMT, Symbol Digit Modalities Test
