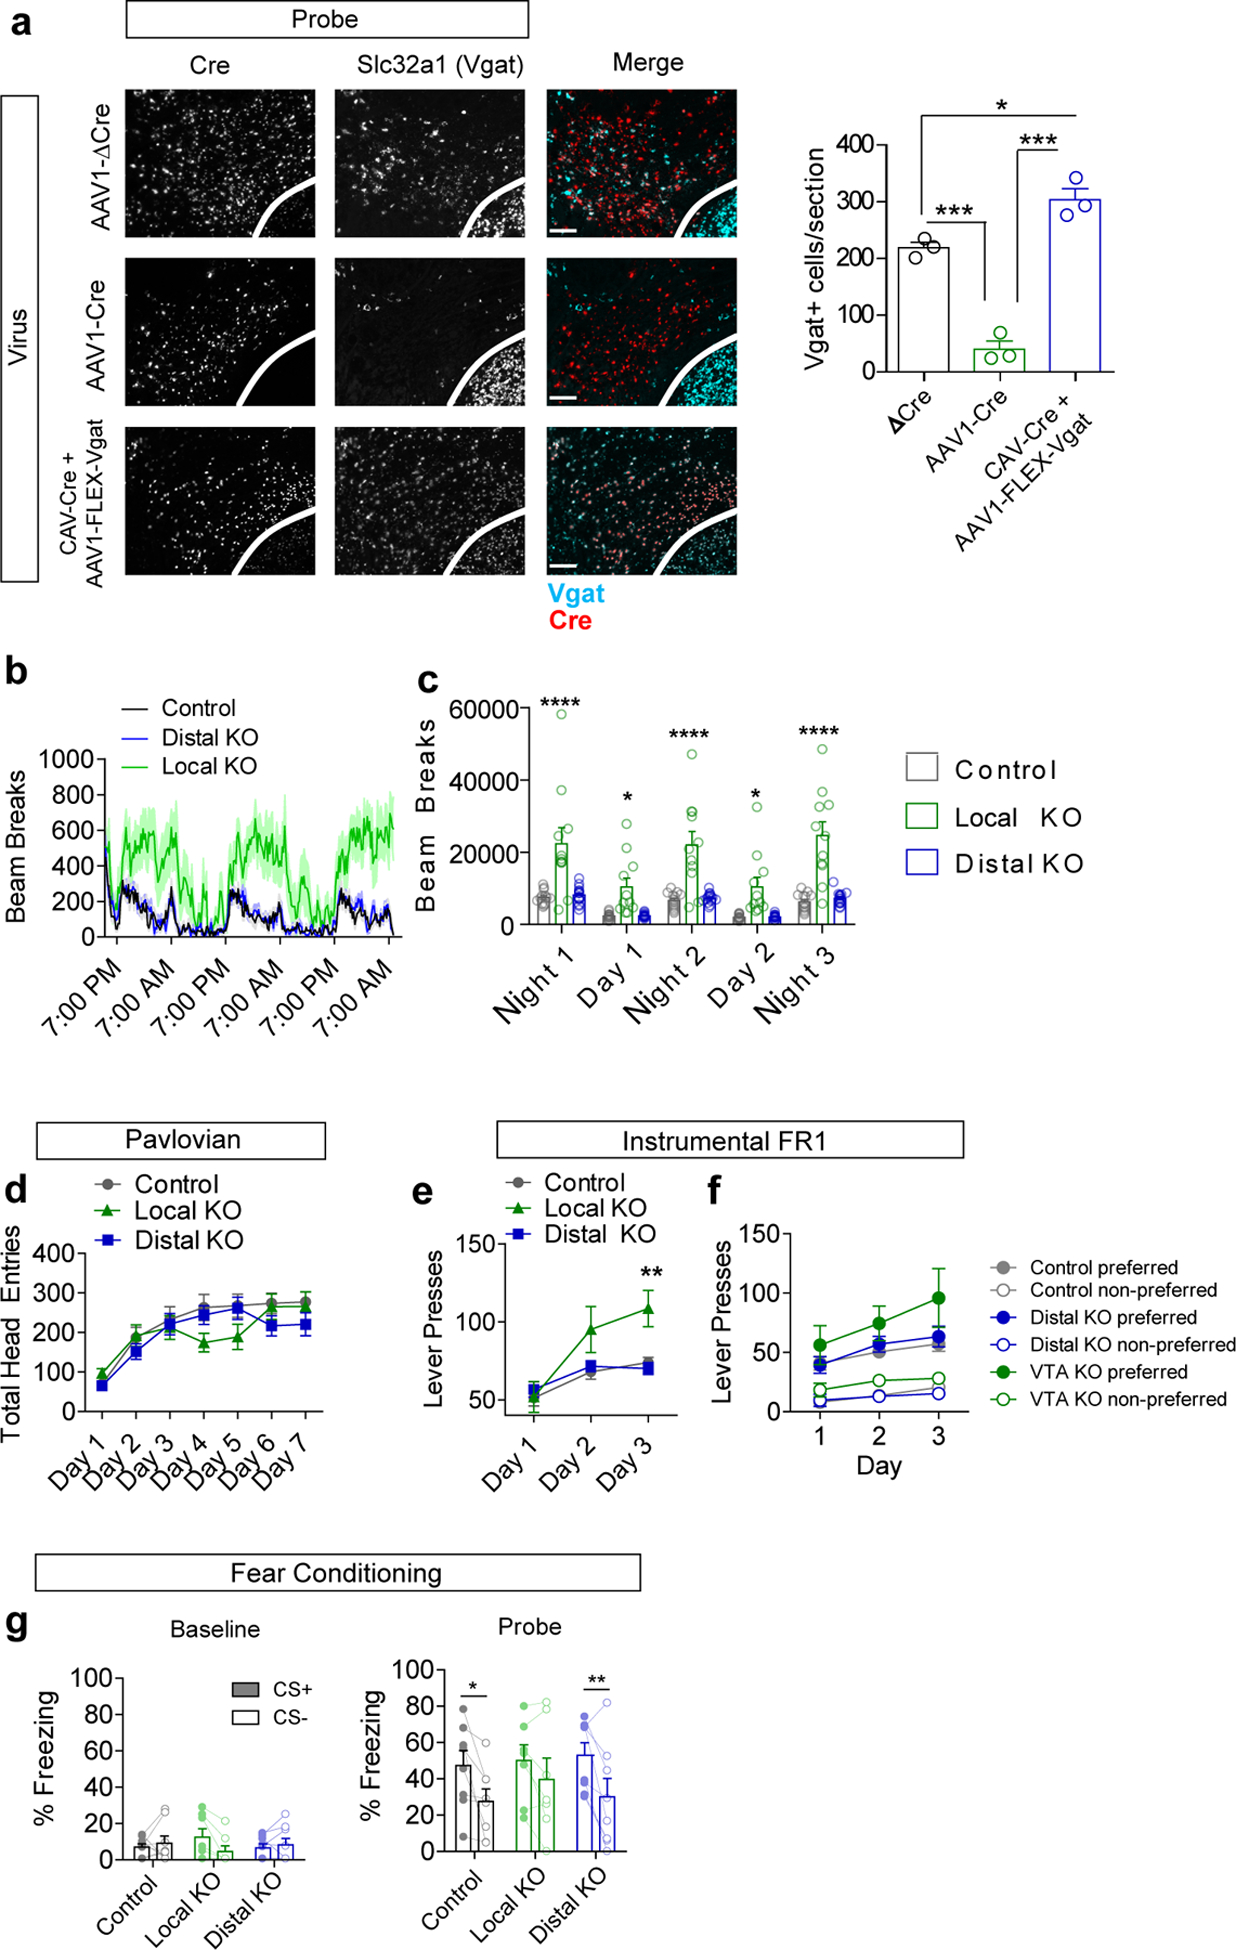
Extended Data Fig. 6. Local and distal Vgat knockout.

(a) Example images of RNAscope in situ labeling Cre and Slc32a1 (Vgat) in the VTA following injection of indicated viruses (red=Cre, cyan=Vgat), and quantification of Vgat+ cells/section (n=3 mice/group, One way ANOVA F(2,6)=77.97 p<0.0001, Tukey’s multiple comparisons *p<0.05, ***p<0.001, scale bar = 100 μm). (b) Locomotor activity (measured as infrared beam breaks) measured in 15 min bins (line) with s.e.m. (shading). (c) Locomotor activity summed over three nights (7 pm to 7 am) and two days (7 am to 7 pm) (Control n=13 mice, VTA KO n=11, Distal KO n=15; Two-way RM ANOVA F(8,144)=6.33, p<0.0001; Bonferroni multiple comparisons *p<0.05, ****p<0.0001). (d) Total head entries during each day of Pavlovian training (n=23 mice/group control, 21 VTA KO, 27 distal KO; 2-way RM ANOVA F(12,402)=1.9, p=0.032; Bonferroni multiple comparisons did not achieve significance). (e) Total lever presses during each day of FR1 instrumental conditioning (1 hour session/day) (Control n=21 mice, VTA KO n=14 mice, Distal KO n=27 mice; Two-way RM ANOVA F(4,118)=5.35, p=0.0005; Bonferroni multiple comparisons **p<0.01). (f) Lever presses on the preferred and non-preferred levers during 3 days of FR1 instrumental conditioning (Control n=15 mice, VTA KO n=11 mice, Distal KO n=15 mice). (g) Percent of time spent freezing during delivery of the CS+ or CS− tone during a baseline pretest or following two days of fear conditioning (n=8 for Control and Distal KO, n=7 for Local KO; Probe: 2-way RM ANOVA significant effect of CS F(1,20)=19.79 p=0.0002, Bonferroni multiple comparisons *p<0.05, **p<0.01). Error bars represent s.e.m.
