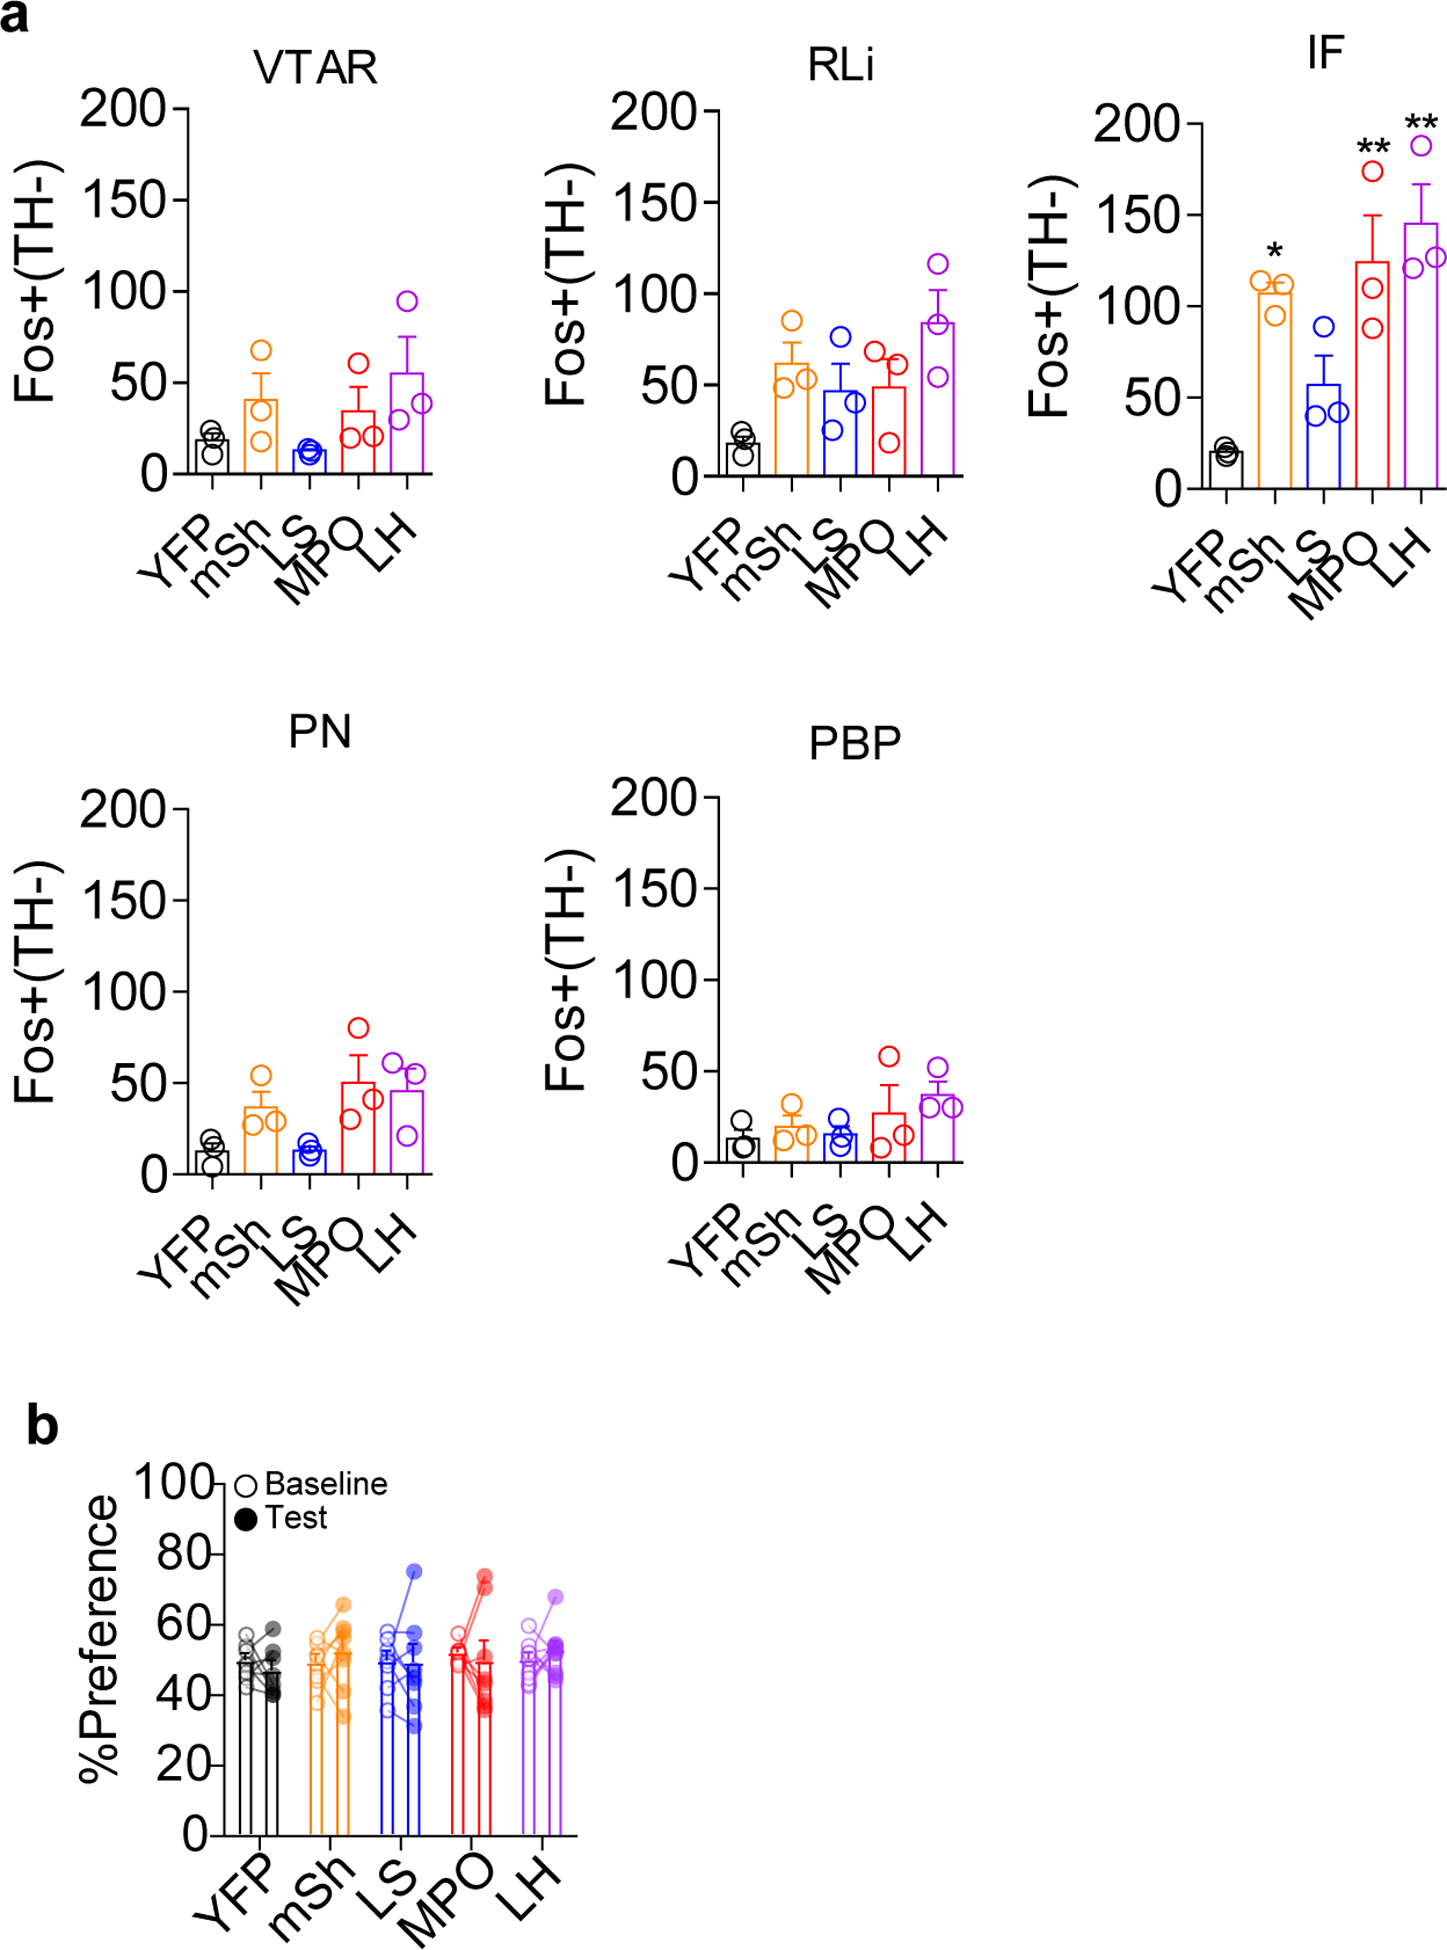
Extended Data Fig. 7. Fos induction in TH− cells and Jaws RTPA.

(a) Number of Fos+ TH− cells in each VTA subregion in Vgat-Cre mice expressing YFP or ChR2-YFP in the indicated brain region. (n=3 mice/group, For IF: One-way ANOVA F(4,10)=9.207, p=0.002; *p<0.05, **p<0.01 vs. YFP.) (b) Real-time place aversion assay comparing percent of time spent in the light paired chamber during the pretest (baseline) period and during the light stimulation period for Vgat-Cre mice expressing YFP or Jaws-GFP in the indicated regions (n=8 for all groups except n=10 for LH). Error bars represent s.e.m.
